Detail view
Clicking on any record from the workspaces list opens the device details. The interface is structured into four sections:
- Available actions at the top
- General information
- Extended information
- Specific information segmented into tabs at the bottom

Available actions
From the device detail view, it is possible to perform the same actions for the active device as in the list view. This includes:
- Microservices execution.
- The actions included in the
Operationsbutton.
Microservices execution
From the >- button, you can run any microservice enabled for the organization that has System as a configured context. This allows the execution of microservices with administrative permissions on the devices.
The actions of enabling, creating, modifying, or deleting microservices are performed from the Portal.
Operations
Clicking on any item in the list view will take you to the detailed device view. From here, you can also execute the same Operations as in the list view, in addition to the Edit and Session Analyzer trace logging operations.
Edit
This operation allows the user to assign an identification code to a workspace. It is a very useful feature to differentiate the device in specific processes, such as inventory, for example. To access this option, click Operations -> Edit -> Code. The Description section allows you to detail what the assigned code refers to.
When the code and the description are defined, they will be visible in the general information block of the device.
Session Analyzer trace logging
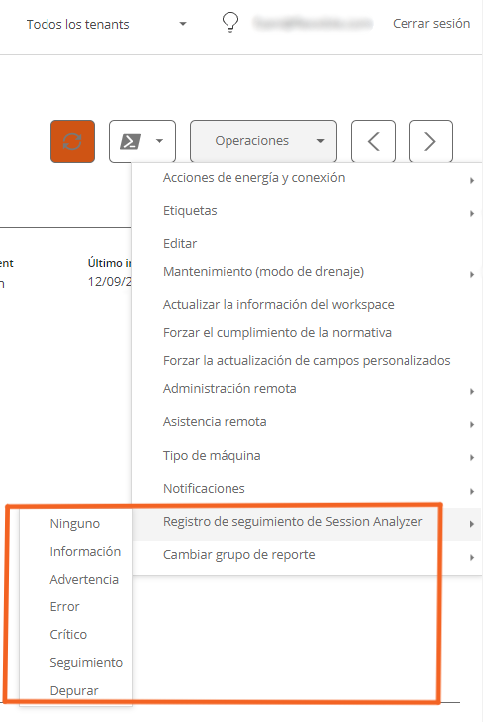
FlexxAgent Analyzer logs can be configured to include or exclude information by criticality levels. From Operations -> Session Analyzer trace logging you can manage the log level change for FlexxAgent Analyzer.
General
The general information block of the device contains:
- Name: Device's hostname.
- State: Power status (on-off).
- FlexxAgent Version: FlexxClient version number.
- FlexxAgent State: FlexxAgent runtime status (running - stopped).
- Last FlexxAgent Report Date: Date of the last report received from FlexxAgent on the device.
- Connection Type: Type of connection used by the device (ethernet - wireless).
- Subnet: Network addressing.
- MAC Address: MAC identifier.
- Network Changes: Indicates if the device has changed its network configuration recently.
- Number of Sessions on the Device: Number of user sessions established on the device in
ConnectedorDisconnectedstate. - Last User: The last user connected to the device in domain\account format.
- Connected From: When the selected device is a VDI or similar, it shows the name of the endpoint from which the virtual device is accessed.
- Connection Time: Connection date.
- Domain: Domain to which the device belongs.
- OU: Domain organizational unit where the device's account resides.
Extended
The extended information block of the device contains:
- RAM: Total amount of RAM.
- Cores: Number of processor cores.
- IP Address: Device's IP address.
- OS: Operating System.
- Operating System: Version of the operating system.
- OS Build: Operating System build number.
- Uptime: The time the workspace has been running since it was last started or restarted. Es importante tener en cuenta que si el inicio rápido (fastboot) está habilitado, el workspace solo está apagado cuando se reinicia.
- Idle Time: The time elapsed since the last input event was received in the user session. Shows 0 if the user is actively using any input device connected to the workspace.
- Last Windows Update: Date of last patch application.
- Last Boot Duration: Duration of the boot (startup) of the last start.
- Pending Restart: Determines if the device has a pending restart to apply updates.
Tabs
The tabs at the bottom show grouped specific information. The following are included:
Sessions
This tab offers a list view for user sessions established on the device, which can be active or inactive (disconnected user).
Performance
This tab groups graphs of the main performance counters for the last two hours.
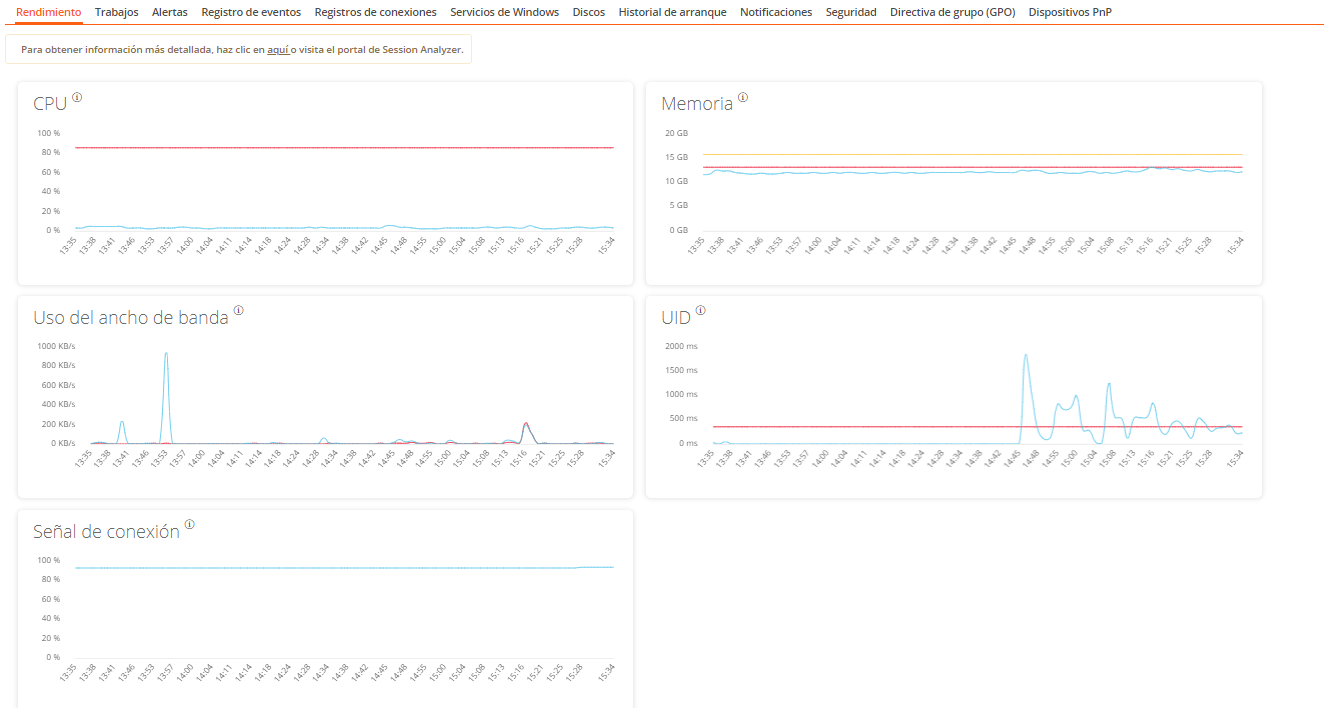 Graphs are included for:
- CPU: CPU usage percentage.
- Memory: Amount of memory used and available.
- Bandwidth Usage: Amount of incoming and outgoing traffic.
- UID: User input delay, refers to the time lag between when a user performs an action, such as clicking a mouse button or pressing a key, and when the corresponding response is displayed on the screen or executed.
- Connection Signal: When the device connects via a wireless method, percentage of signal reception.
At the top of the tab, a link allows direct access to the diagnostic view for the active device in Analyzer.
Jobs
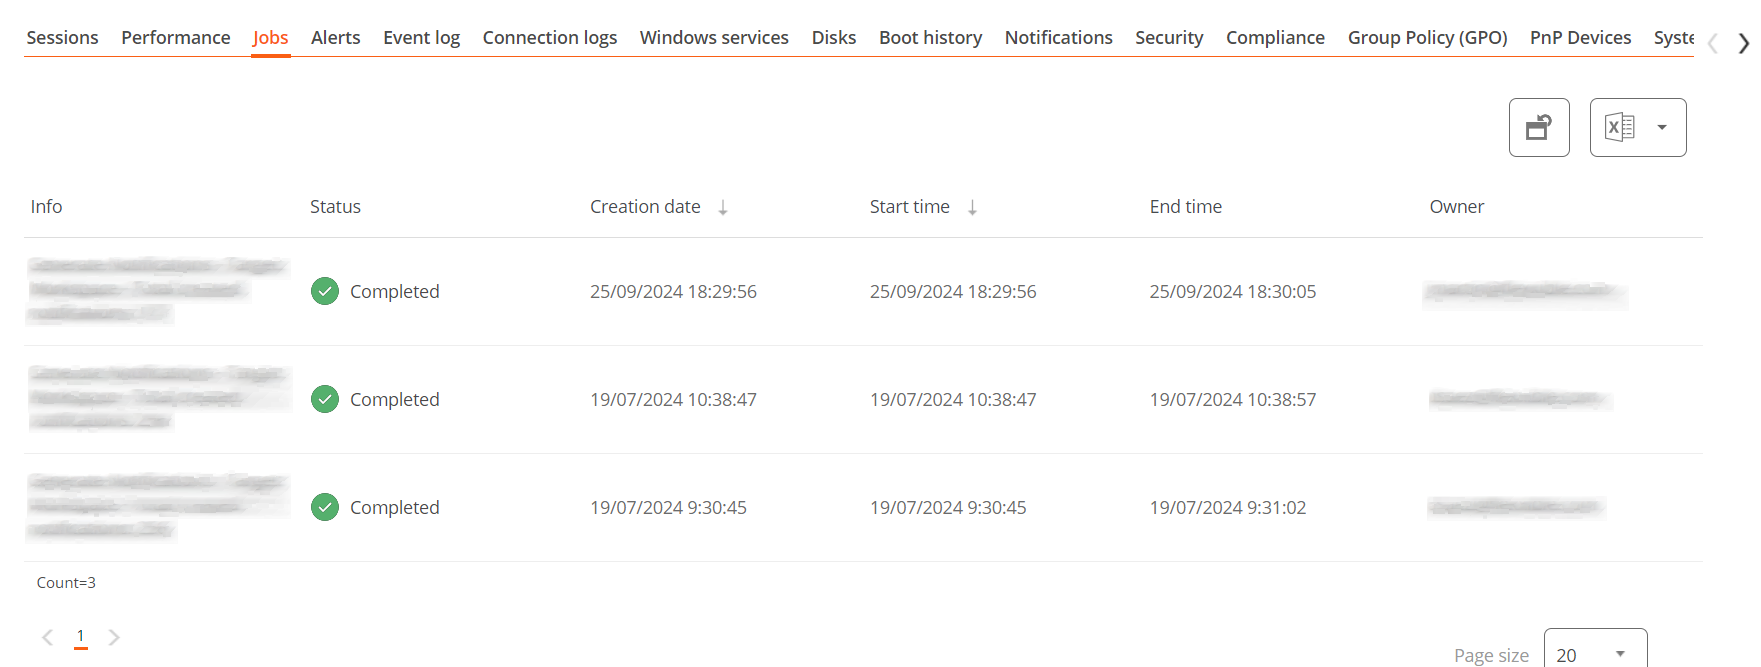 All actions performed from Workspaces on one or more devices are audited in the job queue. This tab allows you to check the jobs performed for the active device without having to go to the jobs section.
Alert
This tab shows a list of all active alerts, if any, for the active device.
When a device has an active alert, a message is also displayed at the top of the screen.

Event Logs
 This tab presents information about the log events on the device. By default, it filters the errors and only shows those errors with severity
 Error or Critical and retrieves them from the device in 10-minute intervals.
Using the options available in the settings, you can modify the sampling time or include specific events by their ID.
Connection log
 This tab contains information about the device's connections, i.e., each time a user starts or reconnects a disconnected session.
The session end date is only reported for disconnected or closed sessions; while the session remains active, the session end date will remain empty.
Windows services
 This tab allows you to view the status of services and perform operations to start, restart, or stop Windows services.
Disks
 This tab offers a list view of all partitions present on all disks identified in the system, as well as statistics on their capacity and occupancy levels.
Boot history
 Esta pestaña permite ver una gráfica de registros históricos del tiempo ocupado en el arranque (boot) del dispositivo.
Notifications
 Allows you to see if the device has any active notifications and its configuration. When there are active notifications, a notice is also displayed at the top of the page.
Security
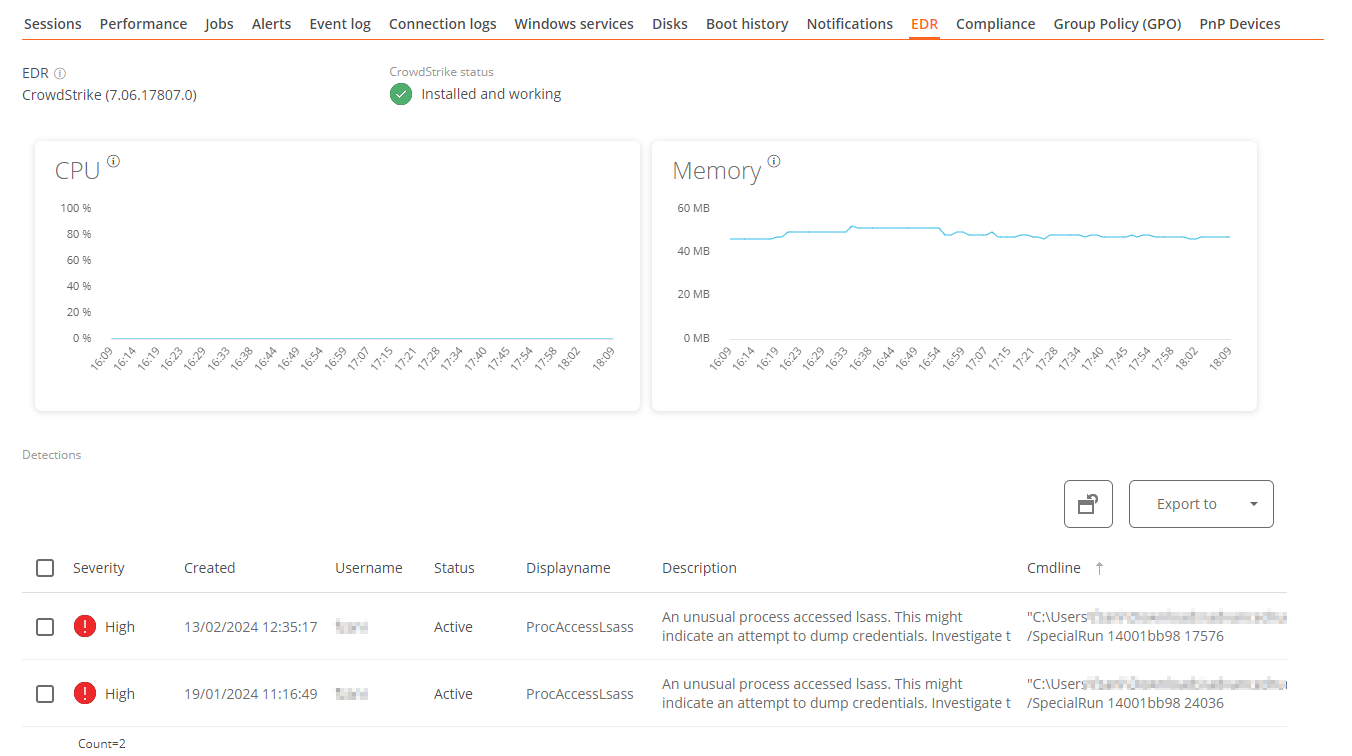
FlexxAgent will detect if a device has Crowdstrike Falcon installed and display the information on the EDR tab of the device detail view. There you can check the installed version, the correct or incorrect execution status, as well as the CPU and memory resource usage.
Compliance
 Allows you to view the compliance policy status configured for the active device. In the available actions at the top, by accessing the
 Operations button, there is the action Enforce Compliance to update this field on demand.
Group Policy (GPO)
This tab shows information about the group policies applied on the active device. Allows you to view the names of the policies as well as the verification time.
PnP Devices
This tab allows you to see at the top the PnP devices that are in an error state, which can be due to hardware or driver malfunctions or incorrect device or driver configurations.
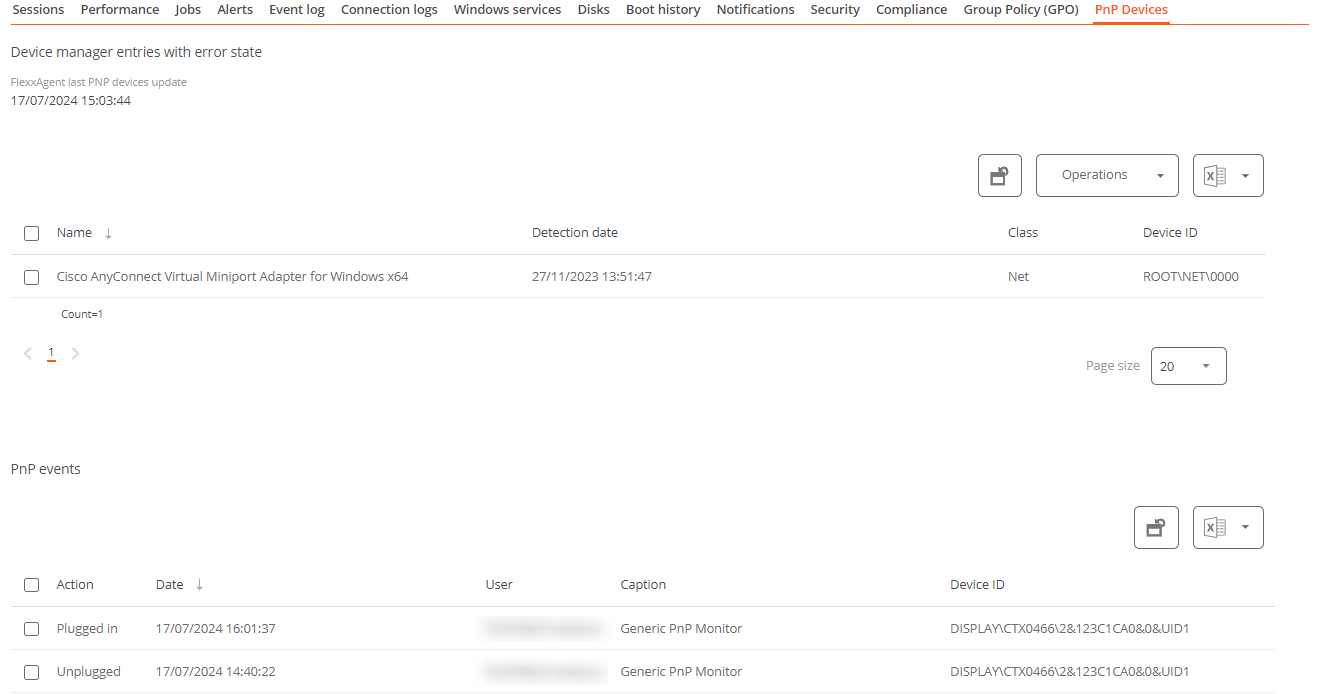 At the bottom of the tab, all PnP events are recorded. Each time a peripheral device is connected or disconnected, a record is generated in this table with the device's information.