Carbon footprint analysis
Green IT is an approach that aims to minimize the environmental impact of information and communication technologies. One of the areas where it can make a significant difference is in the management and optimization of resource usage, such as energy and paper.
This Analyzer option presents a series of metrics and data related to paper printing and the electrical consumption of devices and their peripherals, which are essential for understanding and improving energy efficiency and sustainability in the work environment.
Web Interface
This dashboard view is divided into three tabs:
- Overview. Unified data of the entire carbon footprint generated.
- Printed copies. Shows information about monthly prints in the organization, in black and white or color, as well as metrics of the users and printers generating the most prints.
- Energy. Shows energy consumption generated by the use of devices and their peripherals, as well as data on radioactive waste resulting from energy generation.
Carbon footprint data for electrical consumption and printing are only recorded for physical devices, not for virtual ones.
Overview
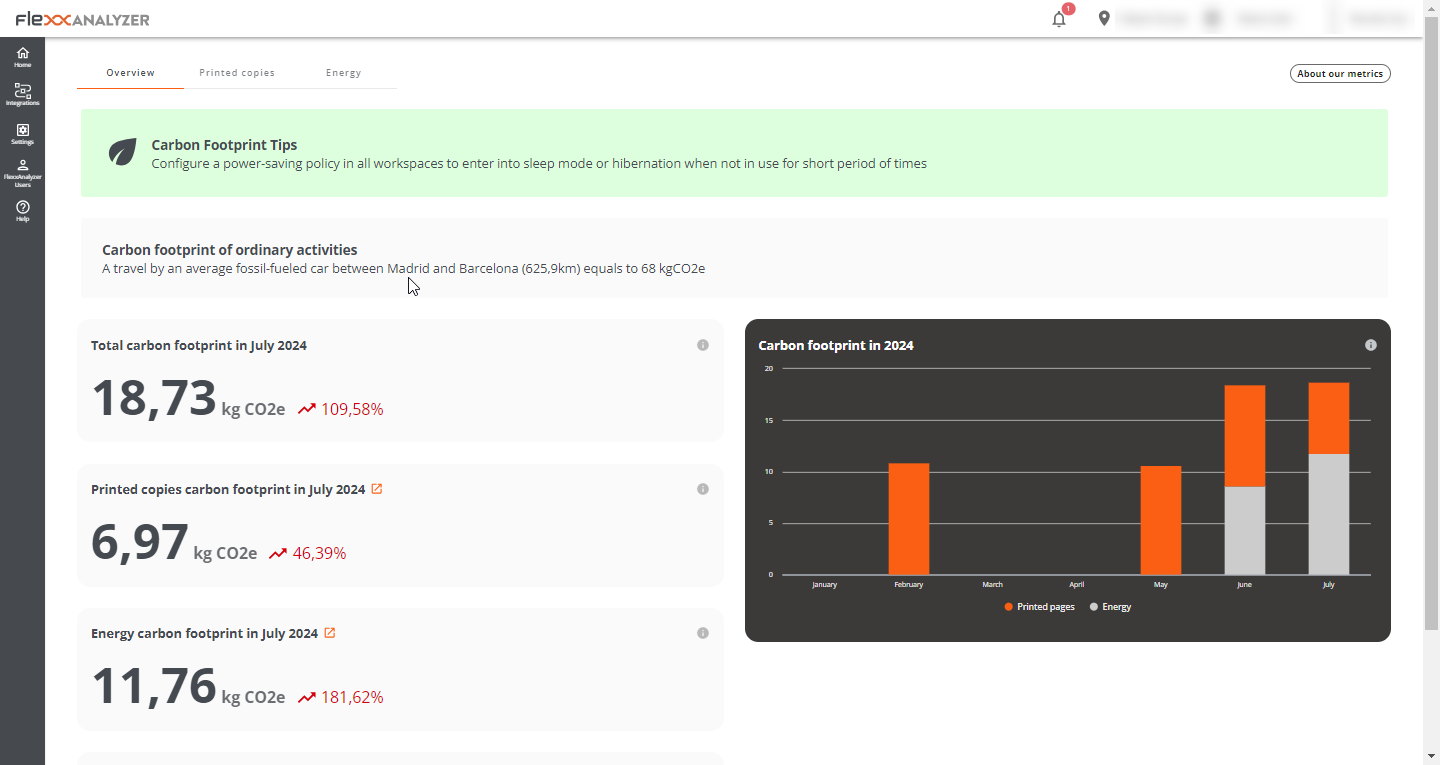
The overview view groups the collected data regarding both energy consumption and prints, to show monthly information.
Data contained in the view (current month):
- Total generated carbon footprint
- Carbon footprint generated by prints
- Carbon footprint generated by electrical consumption
- Amount of radioactive waste generated in the current month
- Graphical view of the monthly evolution of the generated carbon footprint
Printed copies
The adoption of Green IT practices for the management and optimization of resource usage in the field of printing involves taking measures that lead to a reduction in paper and energy consumption, as well as the carbon footprint associated with printing devices.
This section presents a dashboard view with information about the prints made and the carbon footprint generated by this activity.
The carbon footprint of the printed copies is calculated using the following estimates:
- 10 g of CO2e per A4 black and white copy
- 15 g of CO2e per A4 color copy
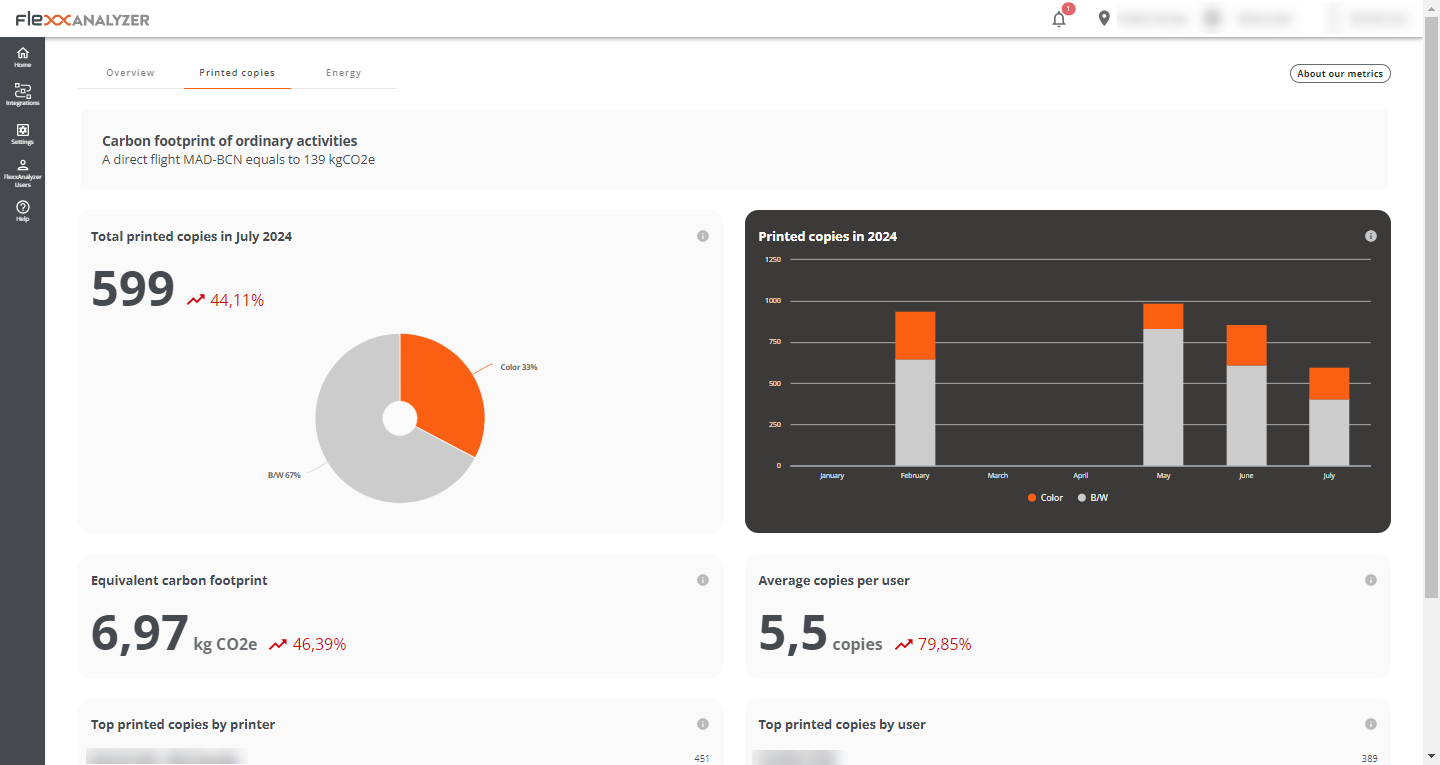
- Total printed copies in [current month]. Displays short-term paper usage trends. Helps identify areas of intensive use, as well as opportunities to reduce the number of prints or promote duplex printing.
- Equivalent carbon footprint. Provides a direct idea of the environmental impact of printing activities. It can motivate the adoption of policies to reduce the carbon footprint, such as digitizing documents and implementing paperless initiatives.
- Top printed copies by printer. View of printers sorted by the number of prints in the current month.
- Printed copies in [Current year]. View of the total black and white and color prints made month by month during the current year.
- Average copies per user. Average prints per user in the current month.
- Top printed copies by user. List of users sorted by the number of prints during the current month.
Energy
The carbon footprint of energy consumption is calculated by multiplying the energy consumption of the device, showing the average kgCO2e per kWh in Spain, which is 0.1 kgCO2e/kWh.
The radioactive material from energy is calculated by multiplying the device's energy consumption and is shown with the average kgCO2e per kWh in Spain, which is 0.512 g/kWh.
This section presents a dashboard view with information about the carbon footprint and radioactive waste generated by the electric consumption of the devices.
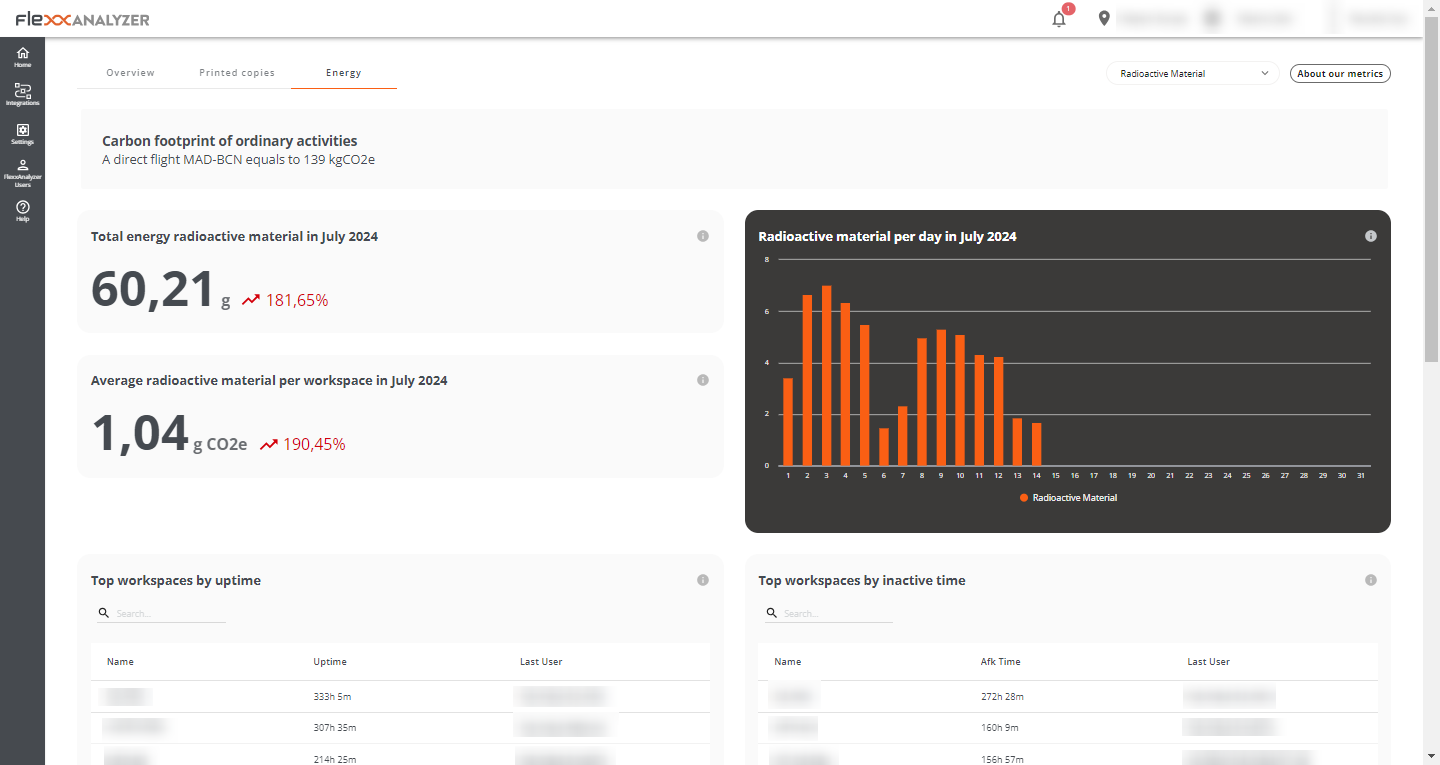
Using the selector on the top right, it is possible to select the view of radioactive material or generated carbon footprint.
Radioactive material
- Total energy radioactive material in [Current month]. Shows the total grams of radioactive material generated during the current month.
- Average radioactive material per workspace in [Current month]. Shows the average radioactive material per workstation in the current month.
- Radioactive material per day in [Current month]. Graph estimating grams of radioactive waste generated in the current month.
- Top workspaces by uptime. Top 10 devices by uptime in the current month.
- Top workspaces by inactive time. Top 10 devices by inactive time in the current month.
- Top workspaces by radioactive material generated. Top 10 devices generating the most radioactive material. Radioactive material calculations are made using the averages of CPU and screen consumption by the average radioactive material generated per kWh in Spain (0.512 g).
- Top workspaces by inactive time and radioactive material generated. Top 10 devices generating the most radioactive material while inactive. Calculated using the averages of CPU and screen by the average radioactive material generated per kWh in Spain (0.512 g).