Workspaces
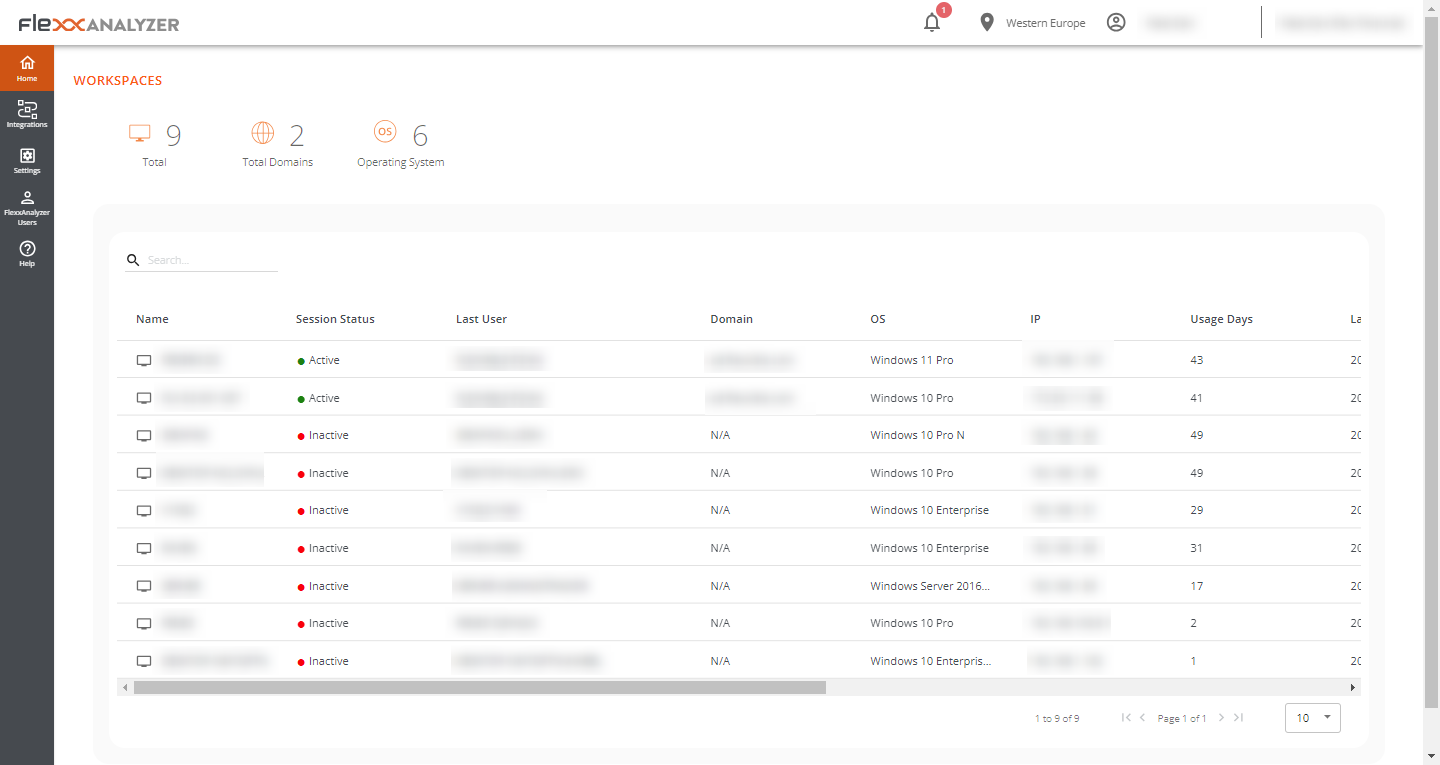
The Workspaces view offers an inventory view of the monitored devices, including identification information, characteristics, as well as their resources, applications, and user usage.
Web Interface

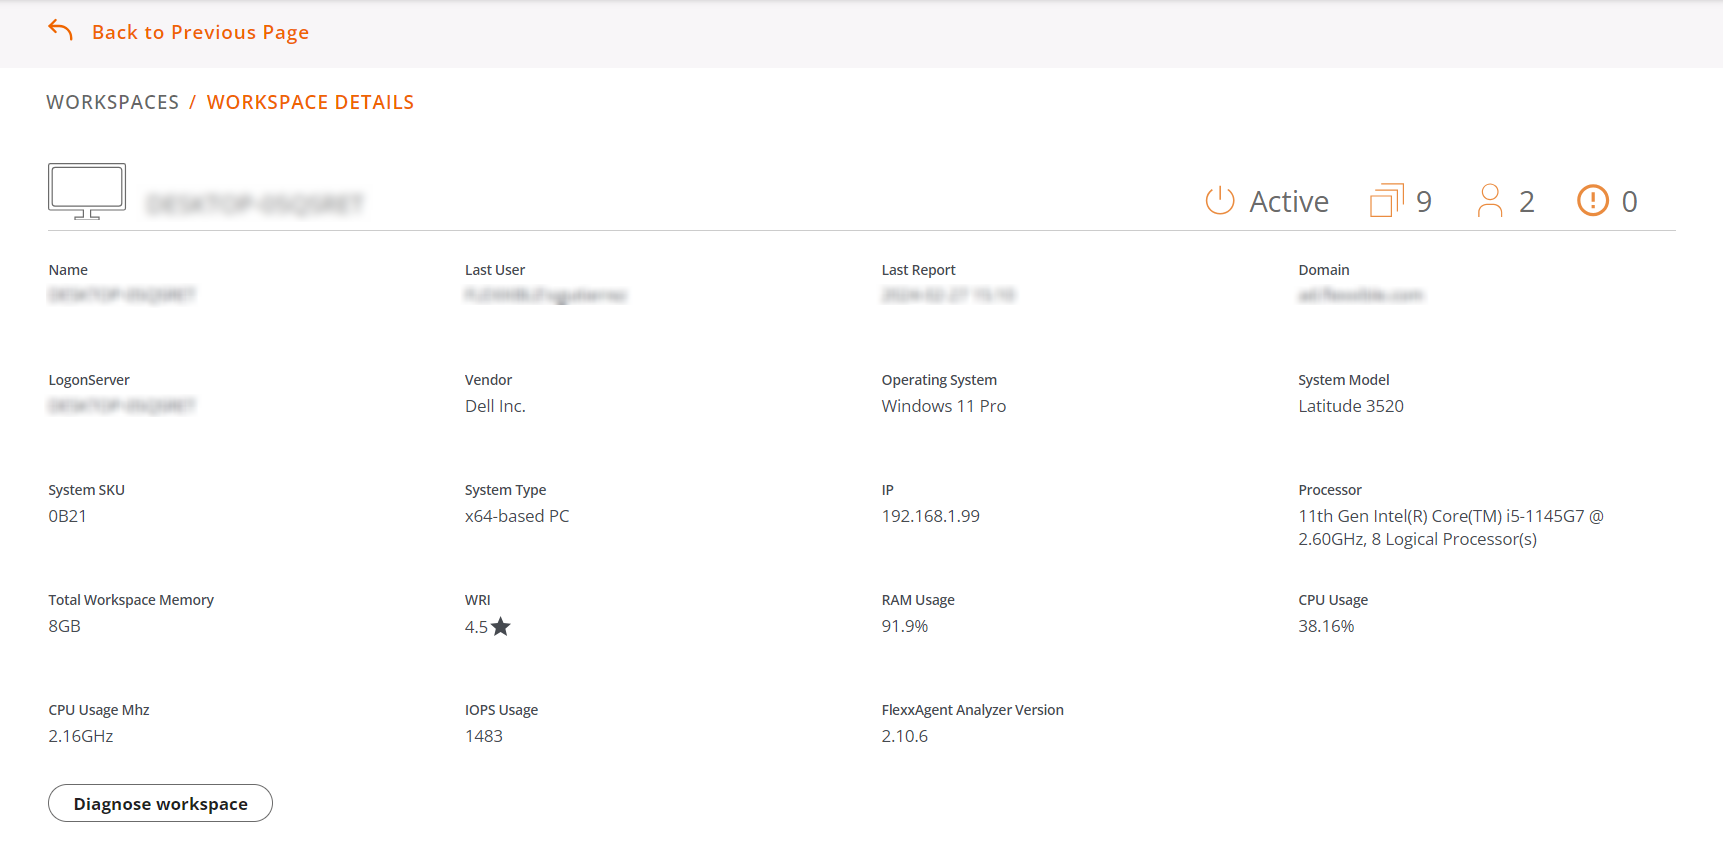
This section consists of a list view with global environment information and the list of devices. Additionally, when clicking on a record in the list, the device detail view is enabled.
List view
At the top, a summary is displayed that includes the total number of monitored devices, the number of registered domains, and the different operating systems detected in the network.

In the list view interface, you can see a list of devices, including the device name, active or inactive session, the domain it belongs to, the operating system it’s using, the IP address, the time it has been in use, the last user who logged in; as well as other technical data such as the device usage of CPU, RAM, IOPS, and the version of FlexxAgent.
Individual Workspace View

The detail view provides detailed information about the device, which includes:
| Name | string de texto que contiene el hostname |
|---|---|
| Last User | Last user who used the device. |
| Last Report | Date of the last report sent by FlexxAgent. |
| Domain | Domain to which the device belongs. |
| LogonServer | Server that authenticates the user when logging in. |
| Vendor | Device manufacturer. |
| Operating System | Device operating system. |
| System Model | Device model. |
| System SKU | Manufacturer SKU identifier. |
| System type | System type, defines the system architecture. |
| IP | Device IP address. |
| Processor | Processor brand name. |
| Total workspaces memory | Total memory present in the system. |
| WRI | Workspace reliability index of the device. |
| Ram Usage | RAM usage percentage. |
| CPU usage | Porcentaje de procesador utilizado. |
| CPU usage | Uso del procesador en Mhz. |
| GPU usage | GPU usage percentage. |
| IOPS usage | Average disk IOPS number. |
| FlexxAgent Analyzer version | Running version of FlexxAgent Analyzer |
Below the listing, there is a button that allows viewing usage data for the device in Diagnosis.
The bottom part of the device detail view consists of 5 sections:
Displays
Contains information about the screens connected to the device, their current and maximum resolutions, and size. This information is also used for estimating carbon footprint based on the electric consumption generated by the screens.
Installed Apps
Shows a list view with data of the installed applications, containing information of the name, version, category, installation date, application group, and unique identifier.
Running Apps
Shows a list of running applications, including the process name and average resource usage for CPU, RAM, and GPU.
Issues in the last 30 days
This table includes the list of alerts generated in Workspaces, which are sent daily to Analyzer, and for each one, it reports the score deducted from the device Workspace Reliability Index.
Usage history
Table with information about the device usage history where you can see the user or users using the device, as well as the days they do so.