Servers
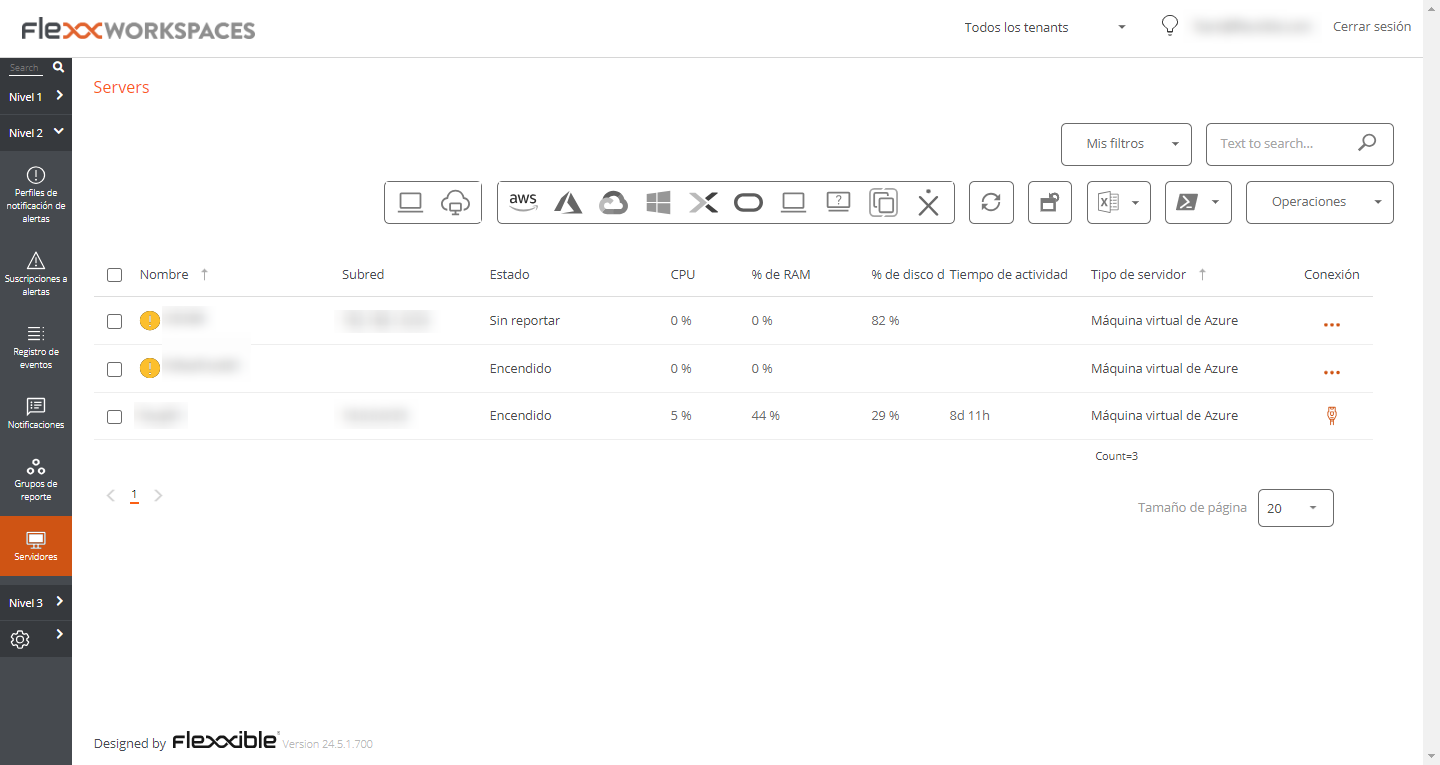
La vista Servidores permite acceder a lista de servidores del entorno, cuando se instala FlexxAgent en un dispositivo, este por defecto aparecerá en la sección Workspaces, para mover el dispositivo a la vista de Servidores, desde la sección Workspaces se debe seleccionar el dispositivo y ejecutar la operación Tipo de maquina-->Server
More information on how to include a device in this list.
List view
The list view contains all the servers configured as such in Workspaces and allows the same actions with the listed devices as in the Workspaces view
Available operations
From the list view, the following tools are included in the upper right corner of the interface:
Filtering options
This view allows the same filtering functionalities available in Workspaces.
Microservices
From the >- button, it is possible to execute any of the Microservices enabled for the organization that have System as the configured context. This allows the execution of microservices with administrative permissions on the devices.
The actions of enabling, creating, modifying, or deleting microservices are performed from the Portal.
Operations
The Operations button allows executing the same device management actions as the Workspaces view.
Detail view
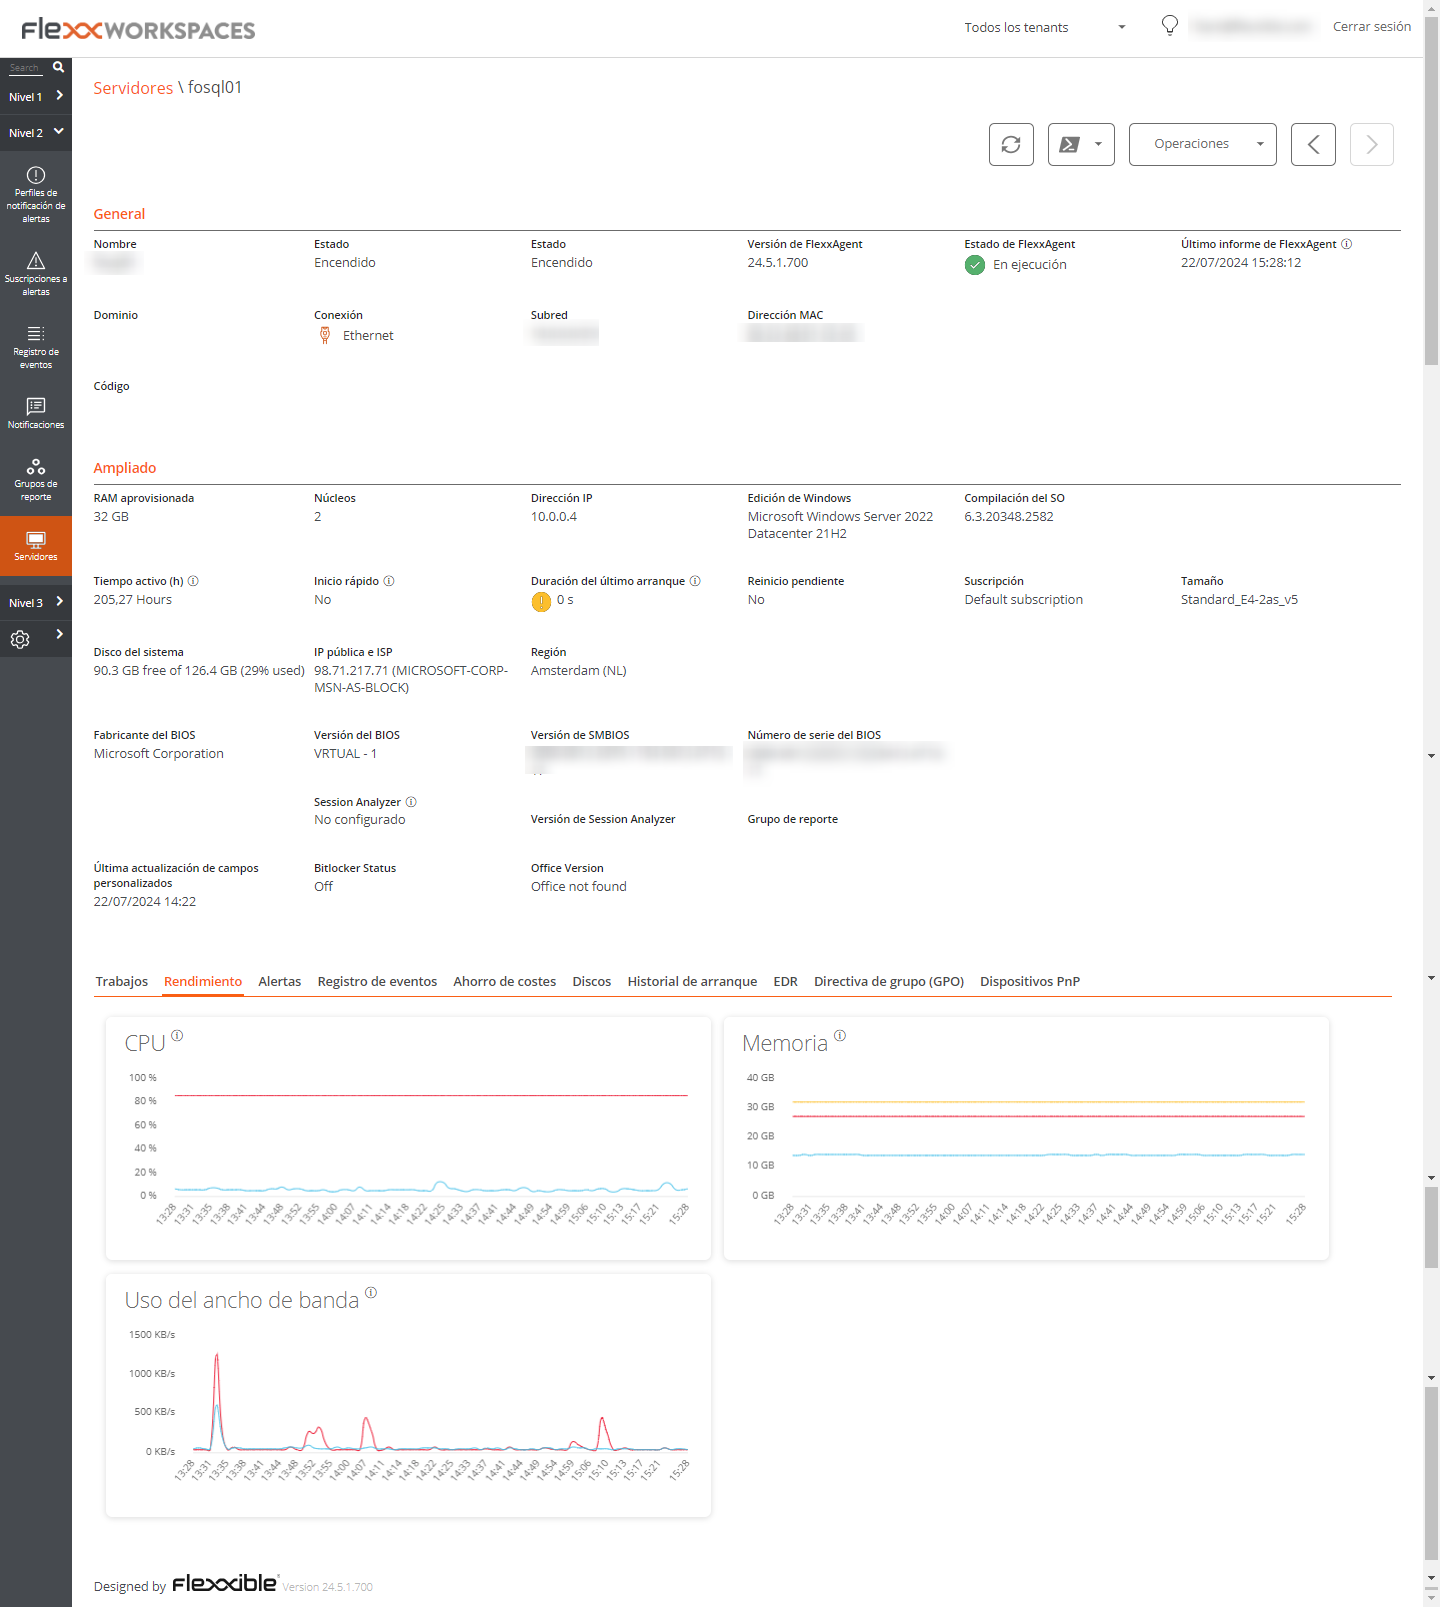
The detail view of a server, in addition to the operations available at the top of the interface, contains the following sections:
- General information
- Extended information
- Specific information segmented into tabs at the bottom
General
The general information block of the device contains:
- Name: Device's hostname.
- State: Power status (on-off).
- FlexxAgent Version: FlexxClient version number.
- FlexxAgent State: FlexxAgent runtime status (running - stopped).
- Last FlexxAgent report date:Date of the last report received from FlexxAgent on the device.
- Domain: Domain to which the device belongs.
- Connection Type: Type of connection used by the device (ethernet - wireless).
- Subnet: Network addressing.
- MAC Address: MAC identifier.
- Code: Allows setting a string as code.
- Network Changes: Indicates if the device has changed its network configuration recently.
- Tags: allows associating identifying tags.
- OU: Domain organizational unit where the device's account resides.
Extended
The extended information block of the device contains:
- RAM: total amount of RAM.
- Cores: number of processor cores.
- IP Address: device's IP address.
- Windows Edition: Edition of the operating system.
- OS Build: operating system build number.
- Tiempo de actividad: tiempo que el workspace ha estado ejecutándose desde la última vez que se inició o reinició, es importante tener en cuenta que si el Inicio rápido (fastboot) está habilitado, el workspace solo está apagado cuando se reinicia.
- Fast boot: Indicates if the server has fast boot enabled.
- Last Windows update: date of the last patches applied.
- Last Boot Duration: Duration of the boot (startup) of the last start.
- Pending reboot: determines if the device has a pending reboot to apply updates.
- System disk: indicates the used space of the system disk.
- Public IP and ISP: If public IP data collection is enabled, it shows the public IP and provider.
- Region: If it's an Azure virtual machine, it will show the Azure host region.
- BIOS manufacturer: BIOS manufacturer.
- BIOS version: Current BIOS version.
- SMBIOS version: Current SMBIOS version.
- BIOS serial number: Unique identifier of the BIOS.
- Session Analyzer: Indicates the status of the FlexxAgent Analyzer process, which can be:
- Not configured: The FlexxAgent is configured to not launch Session Analyzer.
- Disabled: The FlexxAgent is not launching Session Analyzer because it has been disabled using the registry key 'AvoidLaunchAnalyzer'.
- Configured: The FlexxAgent is configured to launch Session Analyzer in all the user sessions.
- Installed: Session Analyzer is already installed in the workspace so FlexxAgent won't try to launch it.
- No compatible: FlexxAgent no inicia Session Analyzer porque no es compatible con el sistema operativo del workspace (por ejemplo, una versión de Windows de 32 bits).
Tabs
The tabs at the bottom show specific grouped information, including the following tabs:
Jobs
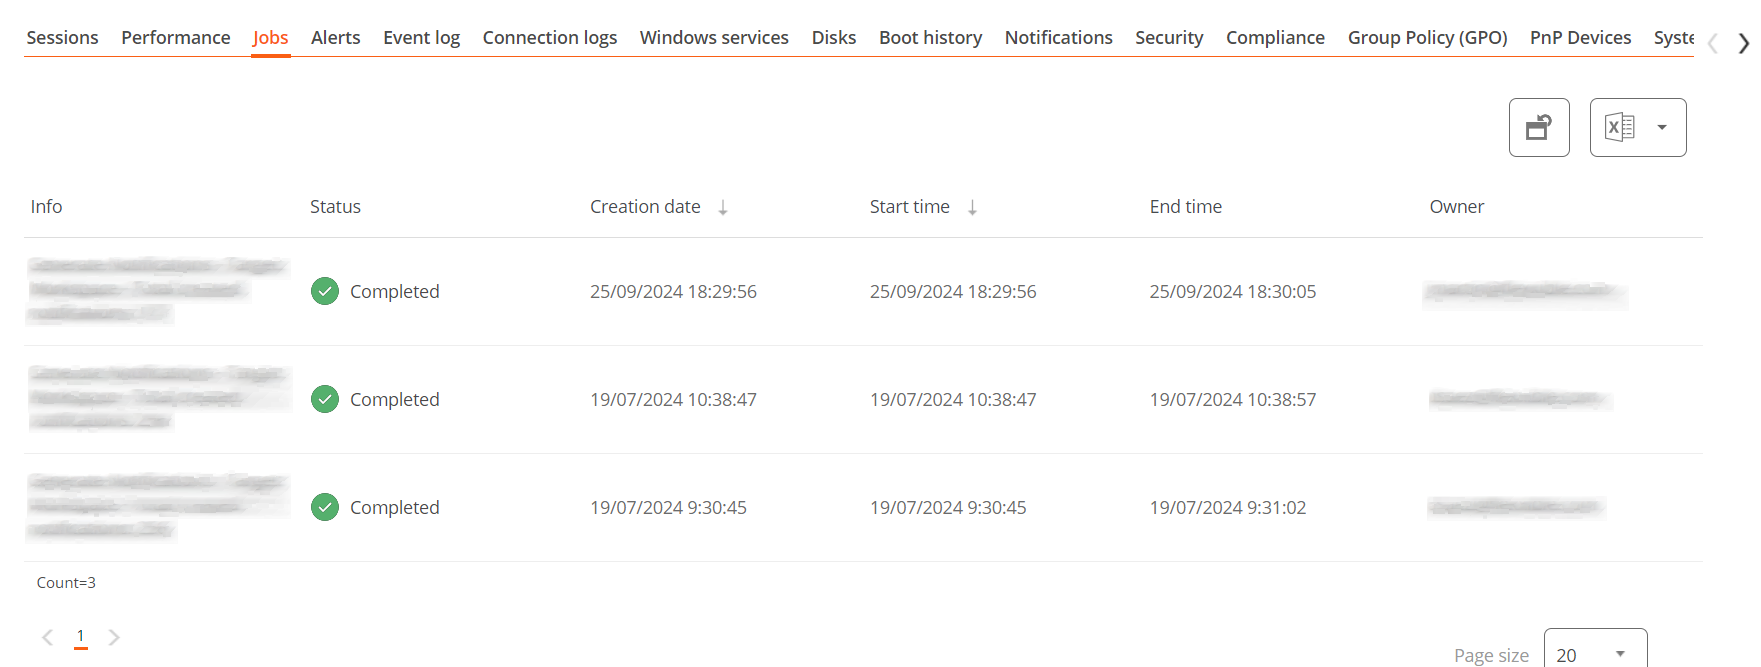 All actions performed from servers on one or more devices are audited in the job queue. This tab allows viewing the jobs performed for the active device, without needing to go to the job section.
Performance
The performance tab shows graphical information about CPU, Memory, and bandwidth usage.
Alerts
This tab shows a list of all active alerts, if any, for the active device.
When a device has an active alert, a message is also displayed at the top of the screen.

Event Logs
 This tab presents information about the log events on the device. By default, it filters the errors and only shows those errors with severity
 Error or Critical and retrieves them from the device in 10-minute intervals.
Using the options available in the settings, you can modify the sampling time or include specific events by their ID.
Disks
 This tab offers a list view of all partitions present on all disks identified in the system, as well as statistics on their capacity and occupancy levels.
Boot history
 Esta pestaña permite ver una gráfica de registros históricos del tiempo ocupado en el arranque (boot) del dispositivo.
Security (EDR)
FlexxAgent will detect if a device has Crowdstrike Falcon installed and display the information on the EDR tab of the device detail view. There you can check the installed version, the correct or incorrect execution status, as well as the CPU and memory resource usage.
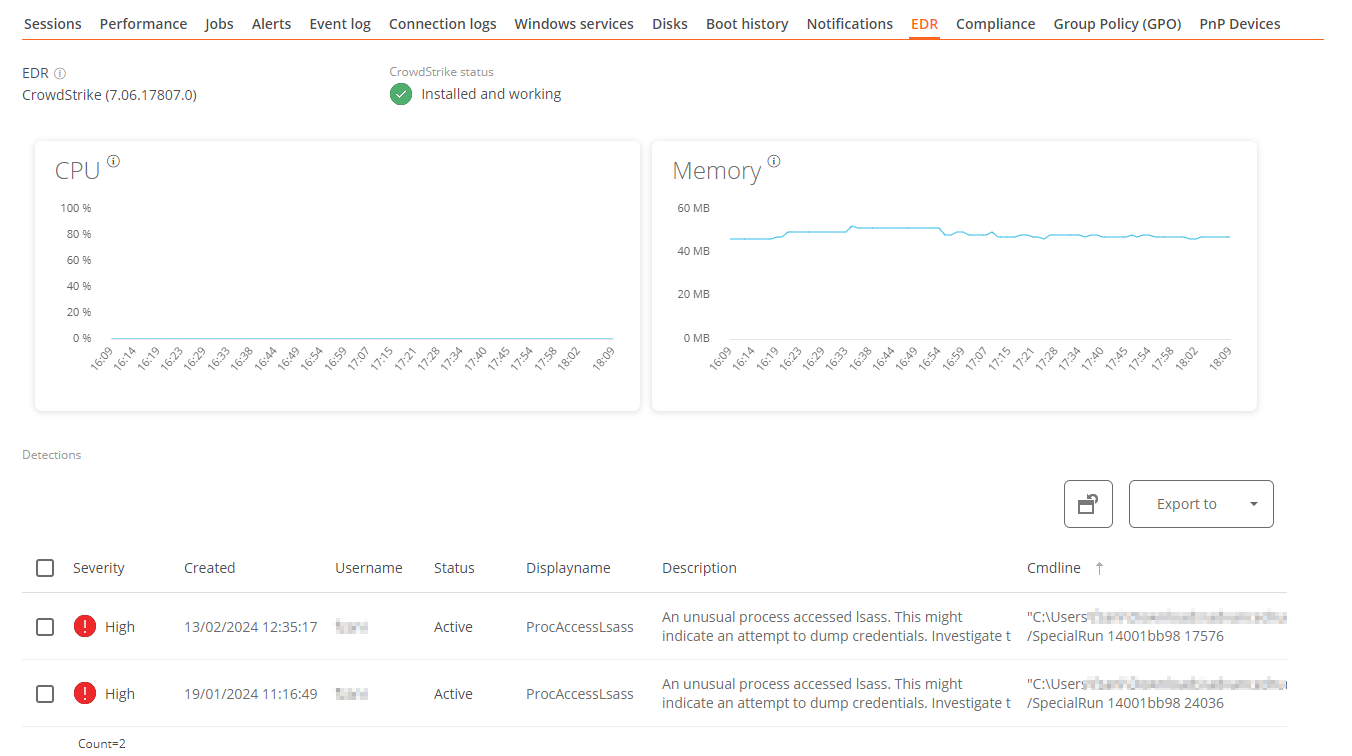
Si además queremos capturar las detecciones para mostrarlas en Workspaces, se deben configurar los datos de acceso mediante API a la instancia de Crowdstrike Falcon en el apartado CrowdStrike de la sección Level 3-> Messaging service (IoT Hub)
Group Policy (GPO)
This tab shows information about group policies applied on the active device, allowing you to view policy details such as name and check time.
PnP Devices
This tab allows viewing the PnP devices that are in an error state at the top. This can be due to hardware or driver malfunction or incorrect device or driver configuration.
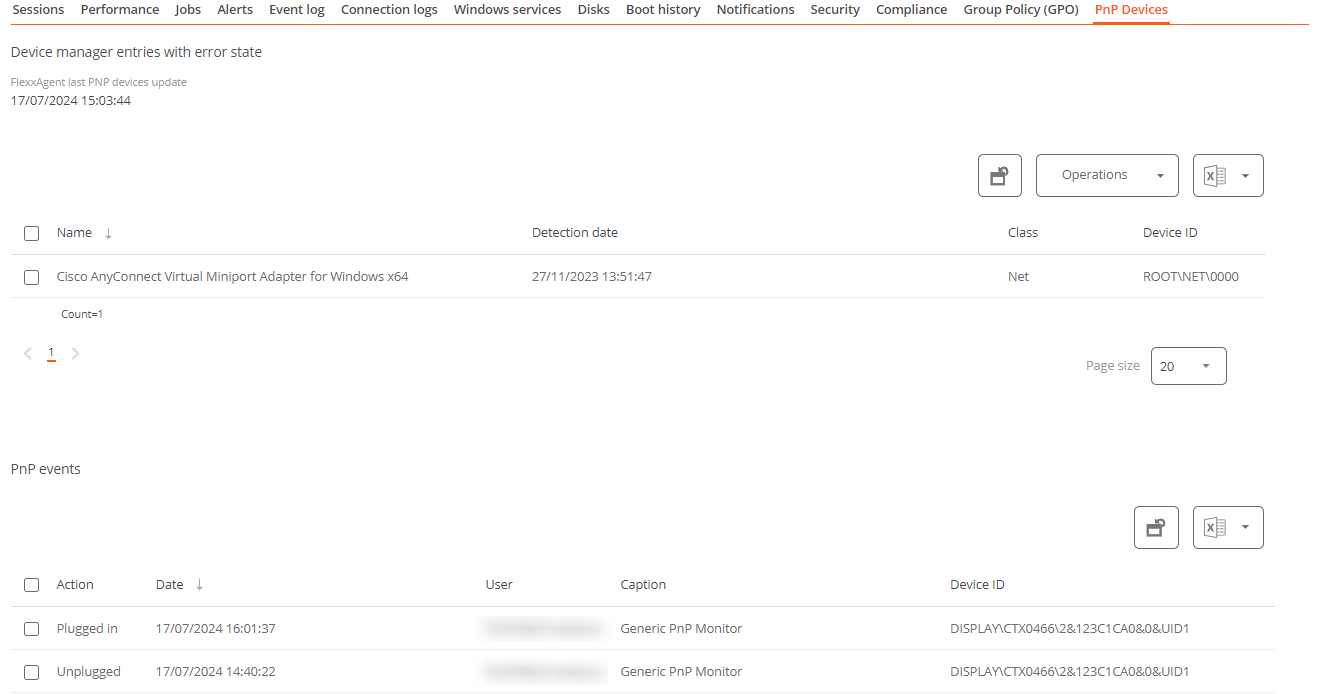 At the bottom of the tab, all PnP events are recorded. Each time a peripheral device is connected or disconnected, a record is created in this table with the information of the device.