Operations
Operations allows you to view and manage actions executed on devices in the environment. It is the main information source for monitoring the execution, status, and result of operations launched from the platform.
Using a dynamic table, users can check detailed information about each operation, including its status, origin, type, and obtained results, which facilitates tracking and diagnosing issues.
To access this functionality, you need to have version 25.12 or later of FlexxAgent installed.
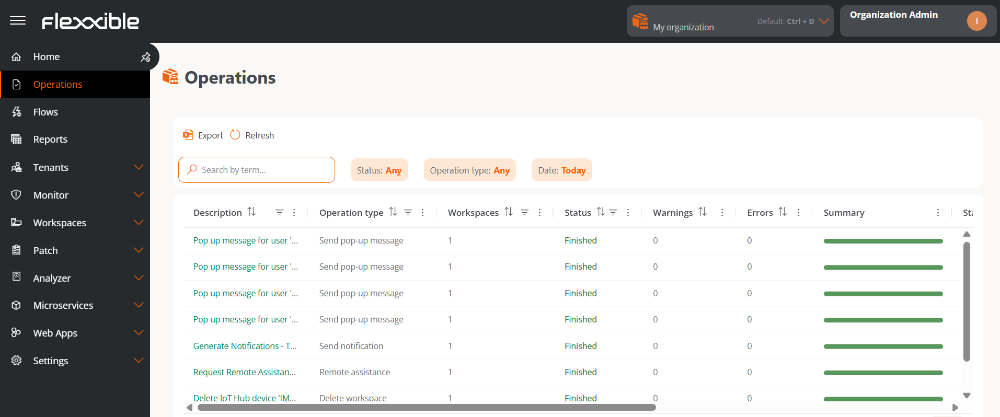
Table info
Each record in the table represents an operation and includes the following fields:
- Description. Brief explanation of the operation performed.
- Workspaces. Number of devices on which the operation was executed.
- Type of operation. Type of operation executed.
- Status. Current status of the operation. See this table for more details.
- Warnings. Number of warnings recorded during execution.
- Errors. Number of errors detected.
- Summary. Visual indicator of the overall result of the operation.
- Initiated by. The user who executed the operation.
- Started on. Date and time when the execution started.
- Complete. Date and time of execution completion.
- Created on. Date and time of operation record creation.
Using the Choose columns option, the user can view additional columns to expand the available information, such as:
- Flow. Name of the flow associated with the operation, if applicable.
- Microservice. Name of the microservice associated with the operation, if applicable.
- FRA Start. Date and time when Flexxible Remote Assistance (FRA) started, if applicable.
- FRA End. Date and time of Flexxible Remote Assistance (FRA) completion, if applicable.
- FRA Type. Type of Flexxible Remote Assistance (FRA) executed: Attended, Unattended, or Dynamic.
Execution States
The operation states are detailed below:
| State | Caption | State category |
|---|---|---|
| Completed | The execution or task has successfully completed and finished its processing. | Final |
| Error | The execution ended due to an error that prevented its successful completion. | Final |
| Session Expiration | The execution exceeded the maximum allowed time and finished automatically. | Final |
| Canceled | The execution was manually canceled or by an external action before completion. | Final |
| Pending | The execution has been created and is pending processing, but has not yet started. | Transitory |
| In progress | The execution is currently in progress and being processed. | Transitory |
| Scheduled | The execution is scheduled to start at a future date or time. | Transitory |
| Unknown | The state of the execution cannot be determined due to lack of information, communication problems, or a condition not accounted for by the system. Requires additional verification. | Final |
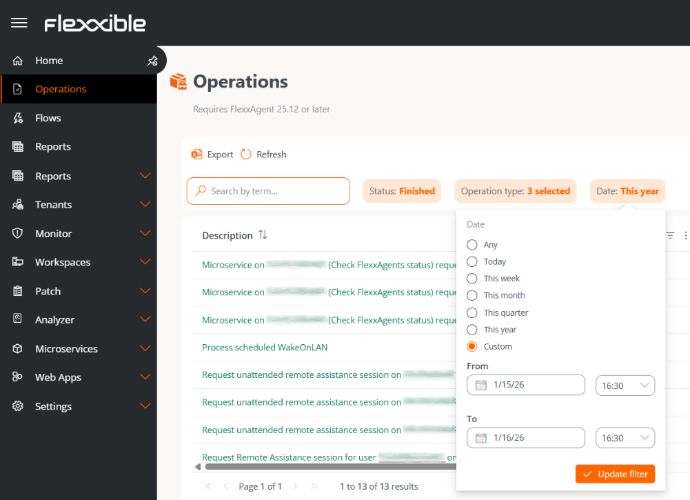
Available filters
The operations table includes filters that facilitate locating and analyzing specific operations:
- Status. Allows filtering by one or more execution statuses.
- Operation Type. Allows filtering by the different types of available operations.
- Date. Allows you to select predefined ranges (Today, This week, This month, This quarter, This year) or a Custom range. The selected period is simultaneously applied to the fields Started on, Ended on, and Created on.
In addition to the previous filters, the columns Description, Workspaces, Started by, Started At, Complete, Created at, Flow, and Microservice allow specific filters directly from the table itself.
Operation details
By selecting an operation from the table, you access its detail view, organized into the following tabs:
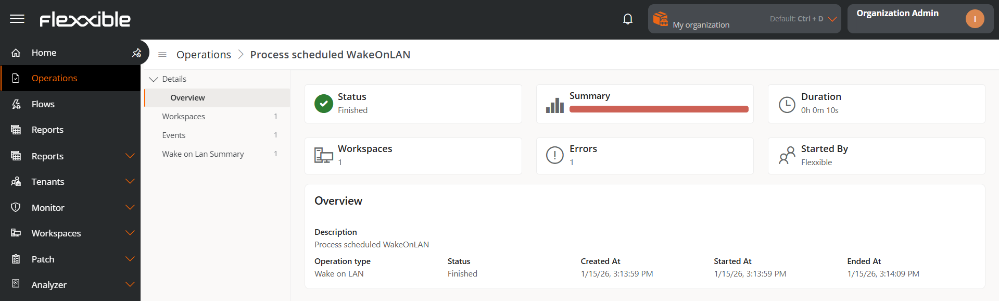
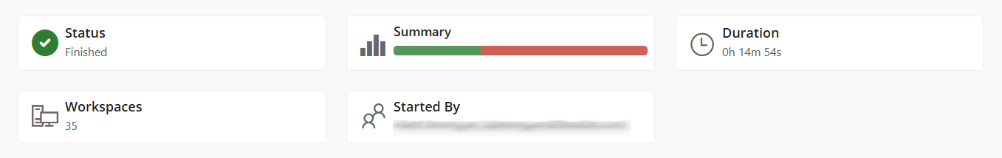
Details
This tab shows summary cards with the main indicators of the operation.
In the Overview section, additional detailed information is presented:
- Description
- Operation Type
- Status
- Created at
- Started At
- Complete
In this section, the available information fields can be expanded based on the type of operation.
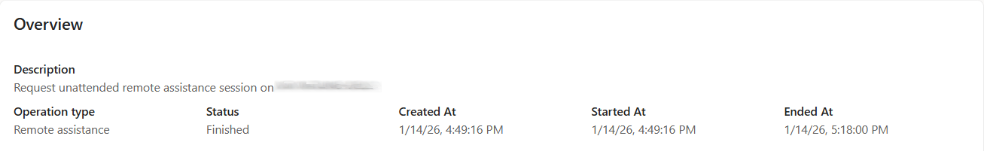
Remote assistance (Flexxible Remote Assistance)
When the operation corresponds to a session of Flexxible Remote Assistance, a specific section is enabled with the following information:

- Type. Indicates whether the assistance is attended, unattended, or dynamic.
- Started At. Start date and time of the assistance.
- Ended At. Date and time of assistance completion.
- Duration. Total session time.
Workspaces
This tab shows a table with the list of devices on which the operation was executed.
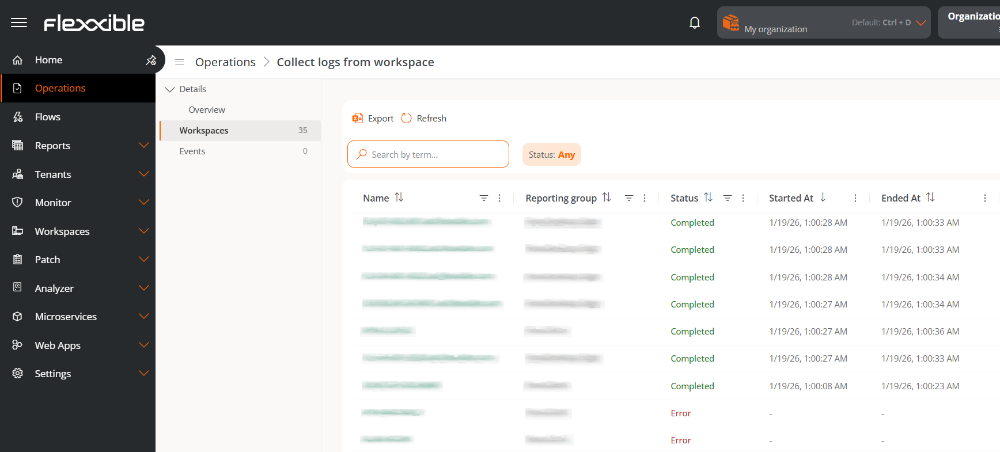
Each record includes the following information:
- Name. Device identification. By clicking on it, the detail view opens.
- Report Group. Reporting group to which the device belongs.
- Status. Execution status of the operation on that device.
- Started on. Date and time when the execution started.
- Ended At. Date and time of completion.
- Actions. Allows access to execution details in operations of type Flows, Microservice execution and User Endpoint microservice.
Events
This section shows the event history generated by the system during the operation execution, allowing error diagnosis or progress verification.
Each event includes:
- Date. Date and time when the event was recorded.
- Type. Event level: Information, Error, or Critical.
- Origin. System component that generated the event.
- Message. Detailed description of the event.
The table records are expandable, allowing you to view the complete message and facilitate the analysis and resolution of issues.
Wake on LAN Summary
This tab offers a comprehensive view of Wake on LAN operations, allowing centralized monitoring of the status and result of automatic device startups. This view is especially useful in operations involving a large number of teams, as it significantly reduces diagnosis time.
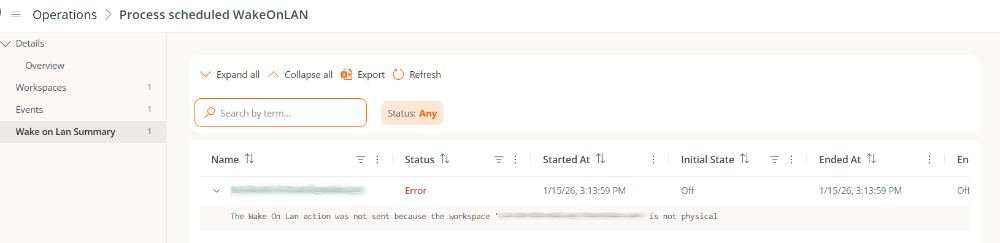
The table includes the following information:
- Name. Name of the device attempted to be turned on.
- Status. Status of the power-on operation.
- Started At. Date and time the operation started.
- Initial State. Power status of the device at the start of the operation.
- Ended At. Date and time of completion.
- Final State. Power status of the device at the end of the operation.
- MAC Address. Unique physical identifier of the device's network card.
- Subnet. Network range to which the device belongs.
From the Choose columns option, as in the operations list table, the user can view additional fields related to Wake on LAN, such as information about intermediate devices, records, or the identifier of the automatic startup schedule.
The records of this table are also expandable, allowing detailed consultation of each operation's diagnosis.
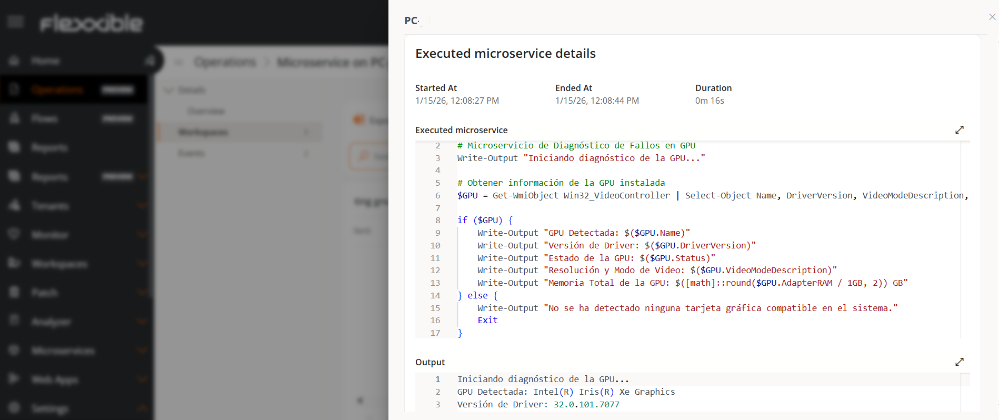
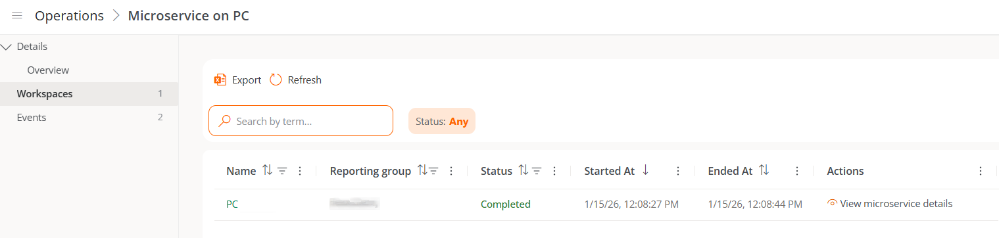
Execution details of a microservice
In operations like Flows, Microservices execution, and End-user microservice, it's possible to check detailed information about the microservice execution on each device. This view expands the information available in the Workspaces tab and allows monitoring the status, duration, and execution result, facilitating incident analysis and resolution.
Access to execution detail
To consult the execution details of a microservice:
- Access
Portal->Operations. - Select the corresponding operation.
- In the menu, open the
Workspacestab. - In the
Actionscolumn of the table, click onView microservice details.
Execution detail information
The microservice execution detail view includes the following information:
- Started on. Date and time when the execution started.
- Ended At. Date and time of completion.
- Duration. Total time elapsed between start and completion.
- Microservice executed. Identifier code of the microservice.
- Output. Information generated as a result of the execution, useful for validating the result and analyzing possible issues.