SAM
SAM allows measuring the use of the organization's licenses when they have been created and configured properly.
Graphs
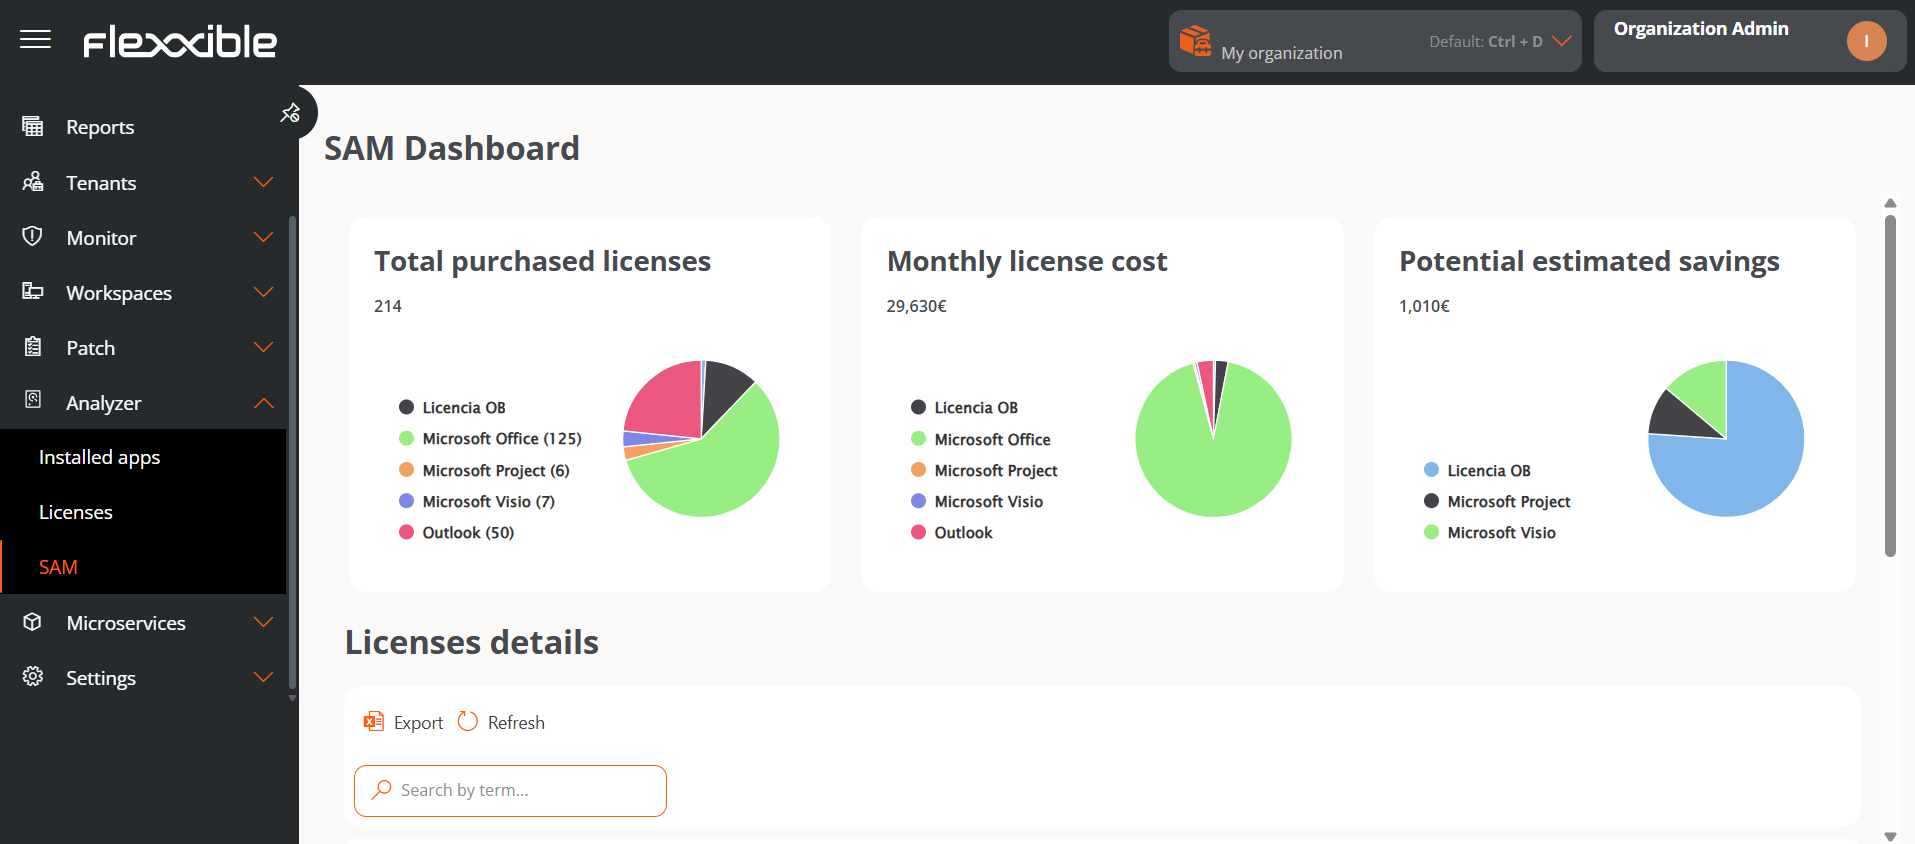
This view consists of three charts providing usage data, costs, and potential savings applicable to the configured licenses.
The license information is calculated on the spot. The use of a license starts being recorded from the moment it is created and the installed applications are associated with it.
The widgets included in the panel contain the following data:
- Total licenses purchased. Number of licenses purchased. The data can be segmented by licenses.
- Total cost per month. In euros, total amount consumed per month. The data can be segmented by licenses.
- Potential savings. In euros, details of licenses not in use that could be opted out to optimize costs. The data can be segmented by licenses.
License Details
This table contains the following information:
- License name
- License type
- Total licenses purchased
- Active licenses
- Inactive licenses
- License utilization rate
- Cost per license
- Projected savings
- Currency
The fields Active Licenses, Inactive Licenses, and License Utilization Rate always show data for the previous month. This allows these indicators to be calculated using full periods and avoids the current month's values being partial.
Clicking on a license leads to its detailed view, which includes:
- The total monthly cost of the license
- The potential savings that can be applied to the license, according to its usage in previous periods.
- The total number of licenses purchased, segmented by licenses in use and inactive licenses.