Active anomalies
This section displays a list of all the anomalies detected in the organization's web applications during the last two hours. The information allows for quick identification of anomalous behaviors related to latency, errors, or request volume in monitored applications.
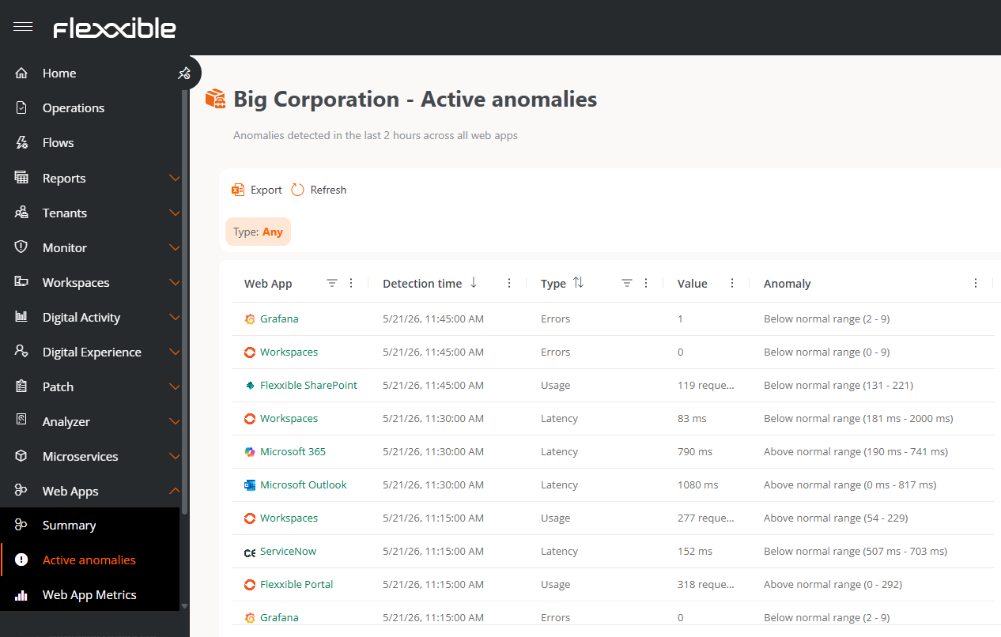
Table info
The table includes the following fields:
- Web App. Name of the web application where the anomaly was detected.
- Detection Time. Exact date and time when the anomaly was identified.
- Type. Category of the detected anomaly: Latency, Error, or Usage.
- Value. The value associated with the detected anomaly, such as:
- Response time in microseconds
- Number of requests
- Number of recorded errors
- Anomaly. Specifies whether the detected behavior is above or below the usual range.
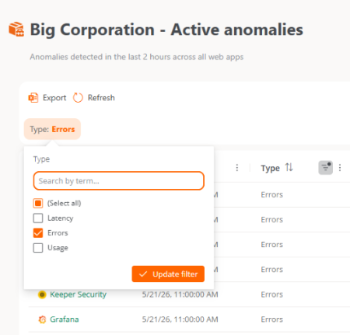
The table content can vary depending on the applied filter.