Sessions
The Sessions view allows real-time monitoring of active sessions on managed devices. Provides detailed information about the connection status, resource usage, and user context, facilitating issue analysis and resolution from a single location.
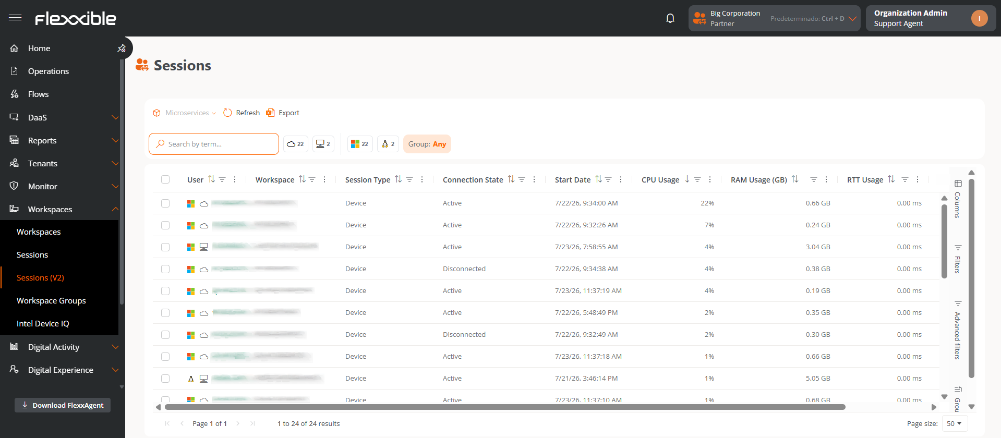
List of sessions
Displays a table listing active sessions along with the following information:
- User. Username of the session presented as
domain\user. It is clickable and allows access to the session detail. - Workspace. Name of the device associated with the session.
- Session Type. Device, Application, SDI Desktop, or VDI Desktop.
- Windows Session ID. Identifier assigned by the operating system to the session.
- Connection Status. Current status of the session.
- Start Date. Date and time the session was established.
- CPU Usage. Percentage of CPU usage associated with the session, excluding other system processes or additional sessions.
- RAM Usage. Memory consumption of the session.
- RTT Usage. Round Trip Time (RTT) of packets between the user's device and the remote destination.
Some columns include informative icons providing additional details about the device's status. For example, the User column may show an indicator with the number of active alerts for the device.
Table customization
The platform offers various tools to tailor the table to the user's needs. It is possible to customize visible columns, apply filters, create groupings, and perform advanced searches.
Category filters
Several quick filters represented by icons are shown above the table. Each indicates the number of sessions that belong to that category.

By selecting one or more filters, the table shows only the sessions that meet all the selected criteria. To deactivate a filter, simply click on it again.
Groups allows filtering by reporting groups.
Columns
The Columns tab is used to customize the information visible in the table. From there, it is possible to:
- Show or hide columns.
- Search for columns by name.
- Modify the order in which they appear.
The configuration is saved automatically. To restore the original, use the Restore button.
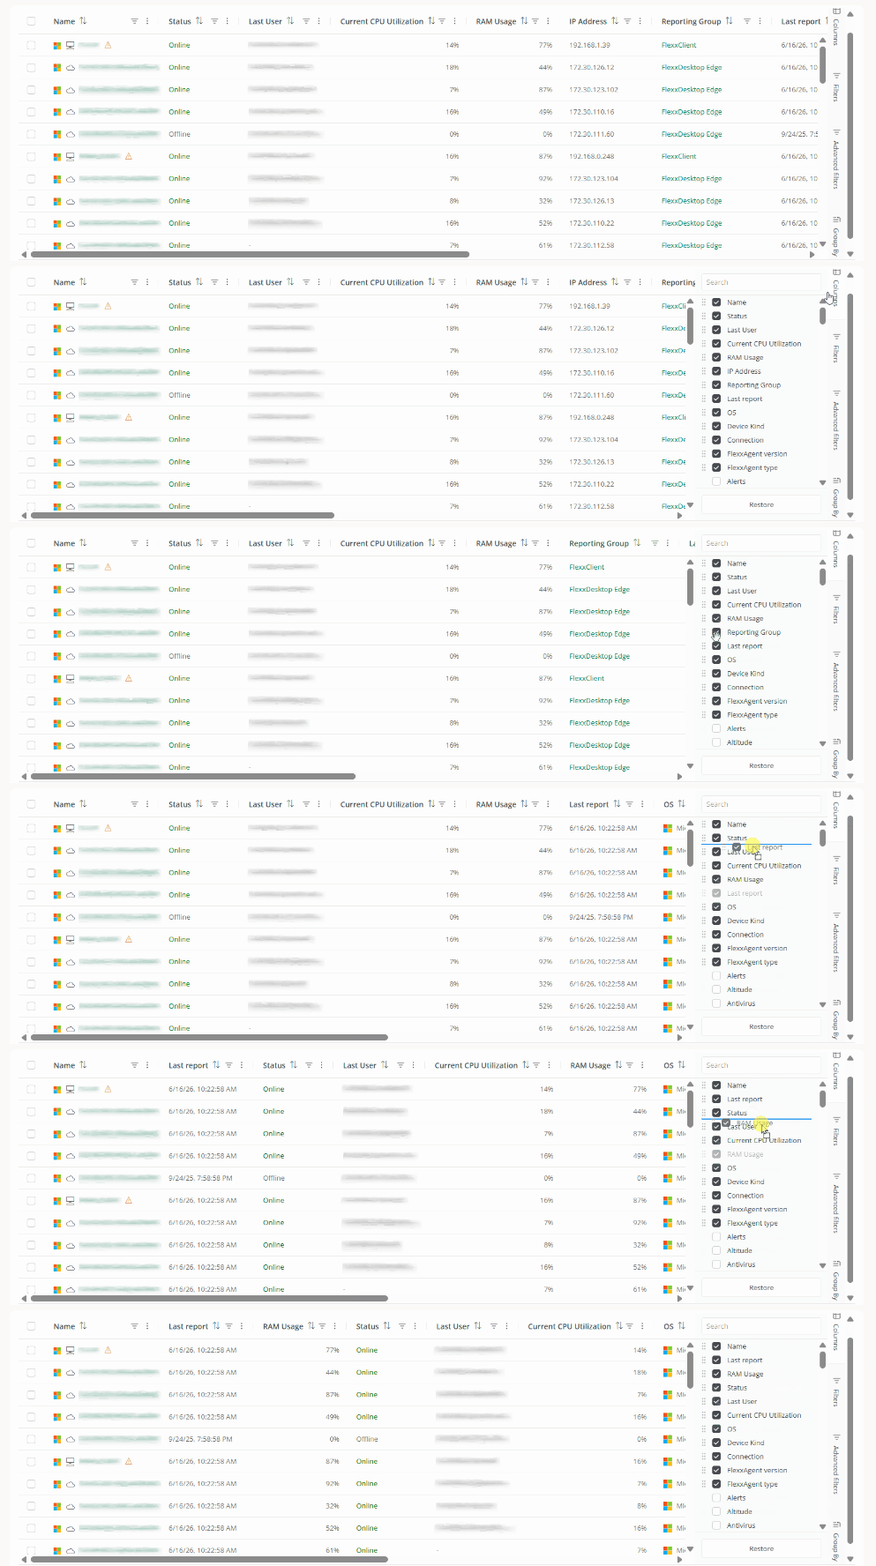
The order of the columns can also be changed directly from the table by dragging a column header to the desired position.
The Choose columns option also allows the user to select additional columns.
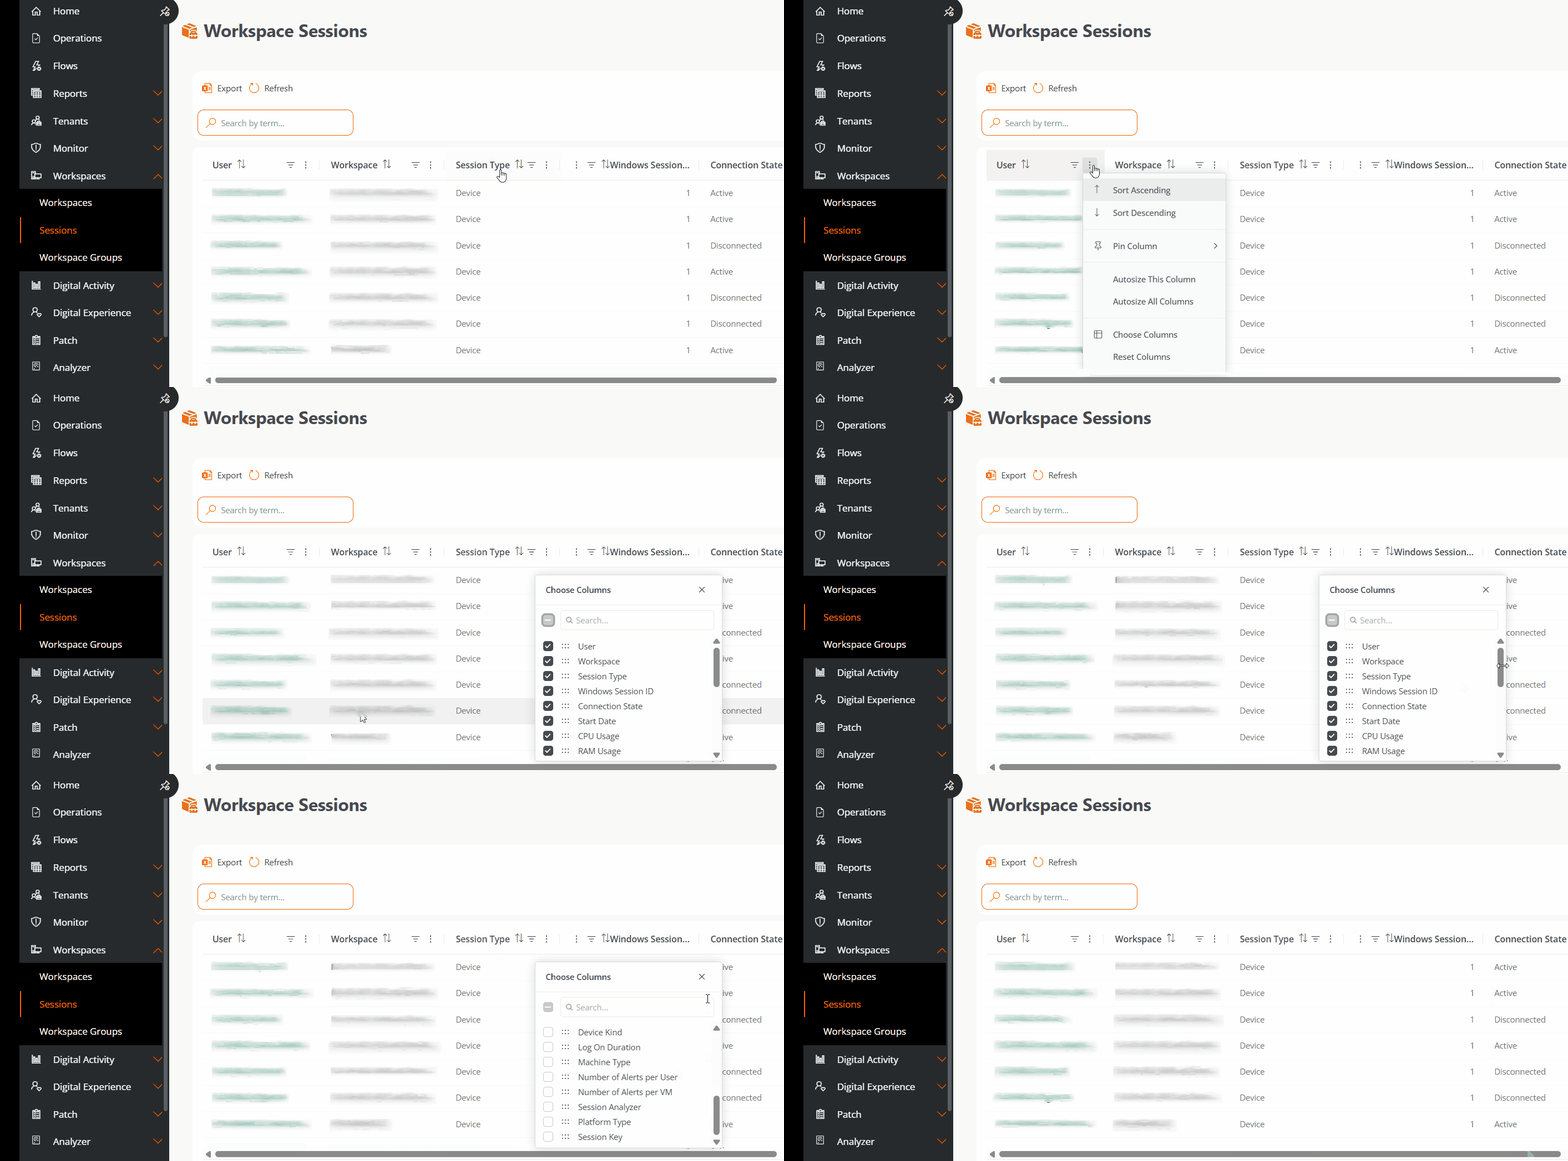
Available columns:
- Connected. Indicates whether the user is currently connected or if the session is disconnected.
- Connection Time. Duration of the session.
- Current Session ID. Identifier of the ongoing session.
- Device Type. Indicates whether the device is physical or virtual.
- Logon Duration. Time needed to complete the logon process.
- Machine Type. Host name of the device.
- Alerts per User. Total alerts associated with the user.
- Alerts per VM. Total alerts associated with the virtual machine.
- Session Analyzer. Indicates if FlexxAgent's session analysis process is active.
- Platform Type. Operating system of the device.
- Session Key. Unique identifier of the session.
Filters
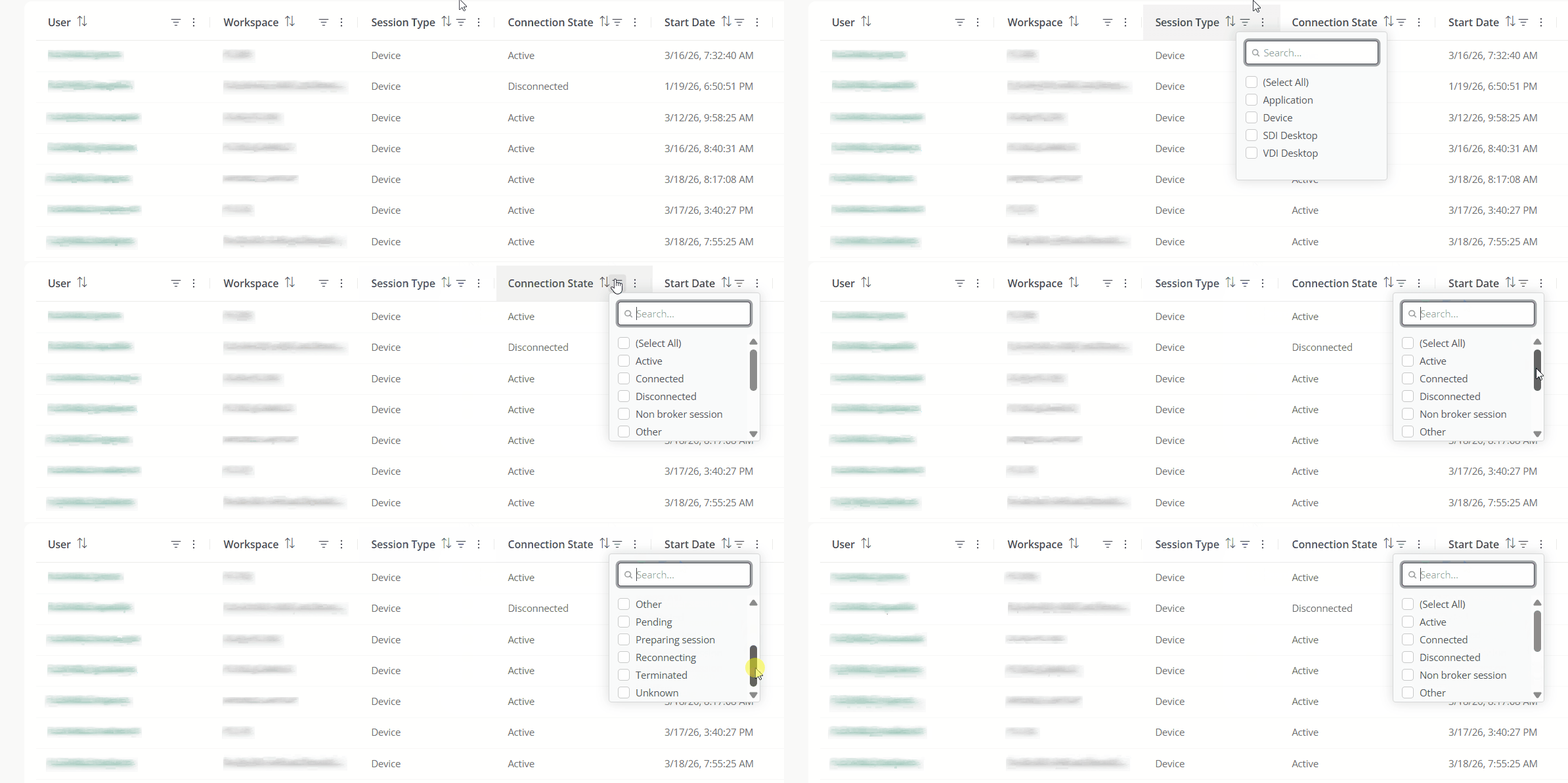
The Filters tab reduces the number of results shown in the table to find sessions that meet certain conditions.
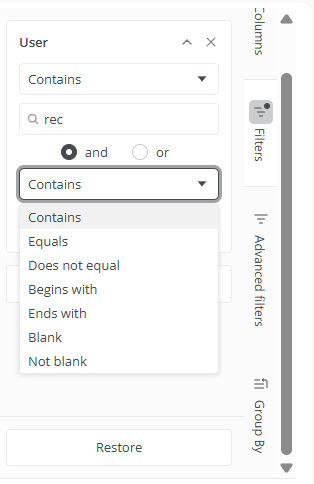
To create a filter:
- Click on
Add filter. - Select the column on which to filter.
- Choose one or more values.
- Add more filters if deemed necessary.
Multiple filters can be combined for more precise searches.
For example, if the Session ID column is visible, it is possible to filter sessions using comparison operators.
Filters are saved automatically and remain available when navigating to other sections of the platform.
To display all sessions again, use the Restore button.
You can also apply filters directly from the column headers using the context menu available on each of them.
Advanced Filters
The Advanced Filters tab expands search options.
- Group. Shows only the sessions belonging to a specific reporting group in the table.
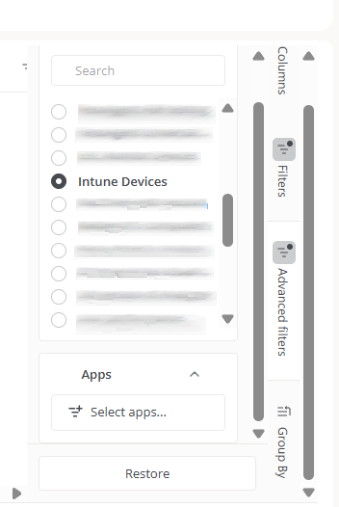
Group by
The Group by tab organizes sessions according to the values of one or more columns.
For example, if the Connection Status column is visible in the table, sessions can be grouped into Active or Disconnected.
Hierarchical groupings can also be created by adding multiple levels. For example, first group by Connection Status and then by RAM Usage.
Values
The Values subsection allows calculating aggregate metrics for each group.
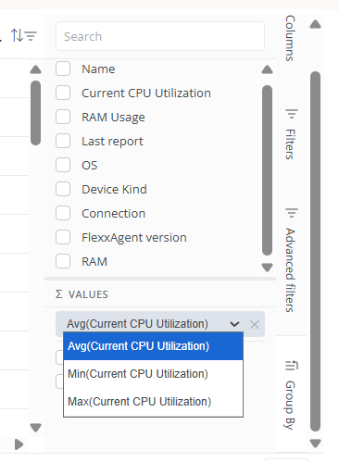
The available operations include:
- Average
- Minimum value
- Maximum value
To remove an aggregated metric, click on the corresponding X icon.
Groups can be removed using the Clear Grouping button or by unchecking the selected fields.
Groupings are particularly useful for analyzing large volumes of information, identifying patterns, and comparing behaviors between different sets of devices.
Session Detail
Clicking on a user's name takes you to their session detail view.
Session information
- User. Username in format
domain\user. - Workspace. Name of the device where the session started. It's clickable and redirects to the Workspaces view.
- Workspace Status. Status of the device.
- Session Type. Indicates the session type: Application, Device, SDI Desktop, or VDI Desktop.
- Start Date. Date and time the session started.
- Connected From. Origin device from which the session was started. Can appear empty if the session is started locally.
- Connected. Indicates whether the session is active or disconnected.
- Device Type. Indicates whether the device is physical or virtual.
- Session Analyzer. Indicates whether the Session analyzer is currently running in the device session.
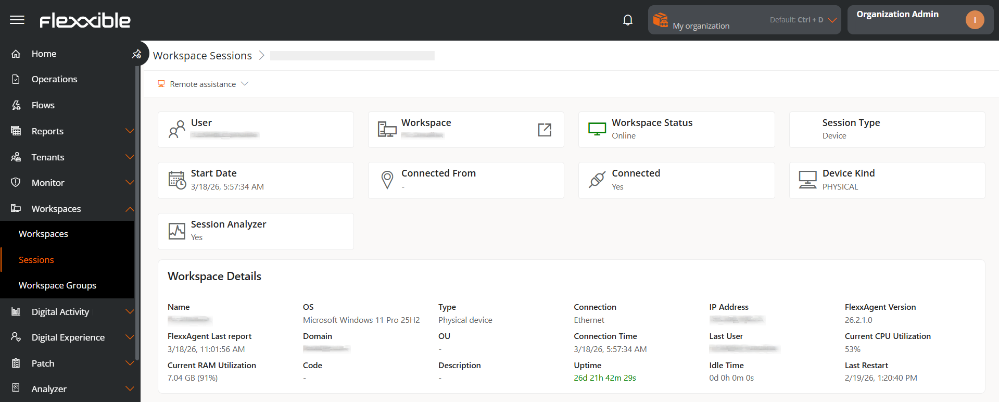
Workspace Details
This section displays technical information of the device associated with the session:
- Name. Device Name.
- OS. Installed operating system.
- Type. Type of device: Physical or Virtual.
- Connection. Type of active network connection.
- IP Address. IP address assigned on the network.
- FlexxAgent Version. Installed agent version.
- FlexxAgent Last Report. Date and time of the last report sent.
- Domain. Domain to which the device belongs.
- OU. Organizational unit within the domain.
- Connection Time. Duration of the current session.
- Last User. Last user who logged in to the device.
- Current CPU Usage. Real-time CPU usage percentage.
- Current RAM Usage. Real-time RAM usage percentage.
- Code. Unique identifier of the device.
- Description. Additional or descriptive information of the device.
- Activity Time. Time the device has been on since the last reboot.
- Idle Time. Time when the device has been off or disconnected.
- Last Reboot. Date and time of the last system reboot.
Flexxible Remote Assistance
Flexxible Remote Assistance is a feature designed to facilitate secure and efficient technical support, allowing an operator to remotely access a device and take control of the user's session to troubleshoot issues, implement changes, or perform administrative tasks.
Perform remote assistance
-
Access
Portal->Workspaces->Sessions. -
In the table, select the session on which you want to perform assistance.
-
Click on the
Remote Assistancebutton. -
Select the type of assistance.
-
Wait a few seconds and download the activation file.
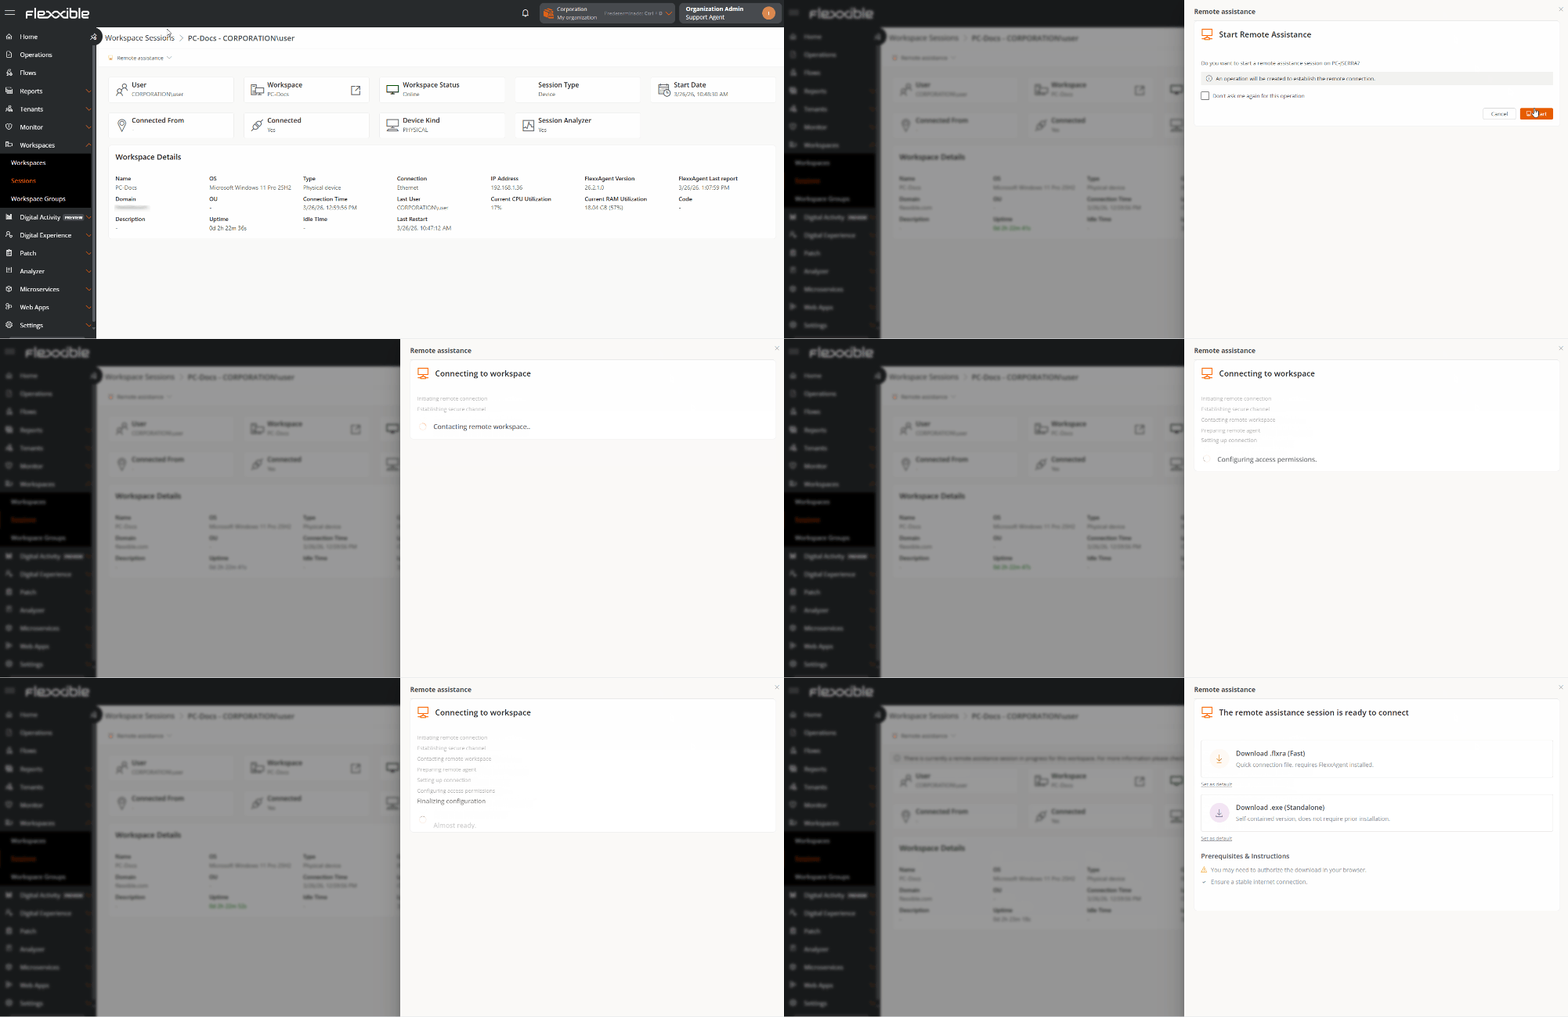
-
User consent will be requested before the operator can take control.
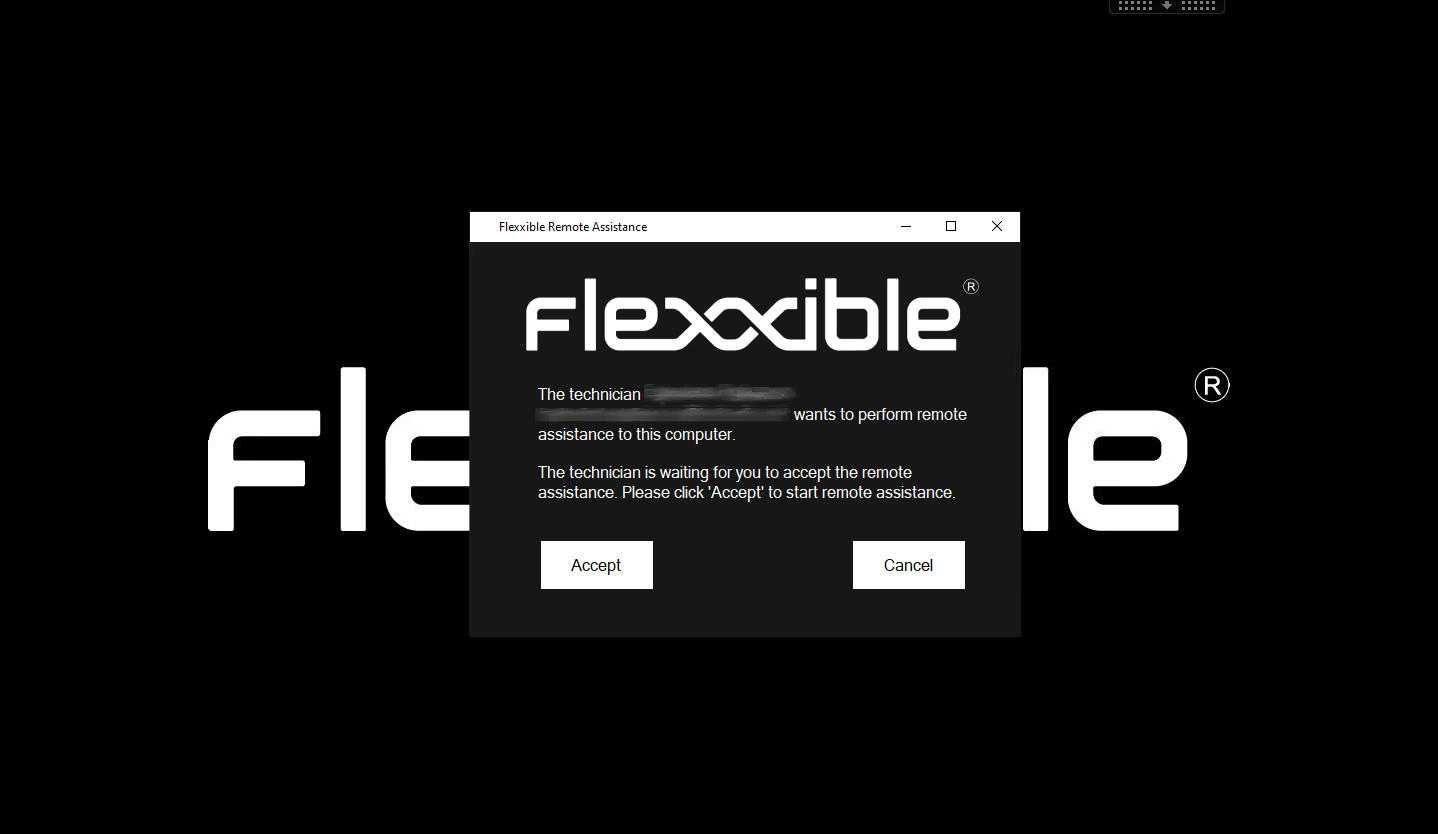
-
Begin remote assistance.
When remote assistance is in process, the device detail view displays the message:
Currently, there's an ongoing remote assistance session for this workspace. For more information, see the section Operations.

For more detailed information on executing remote assistance from the Portal, check its documentation.